-
A, B
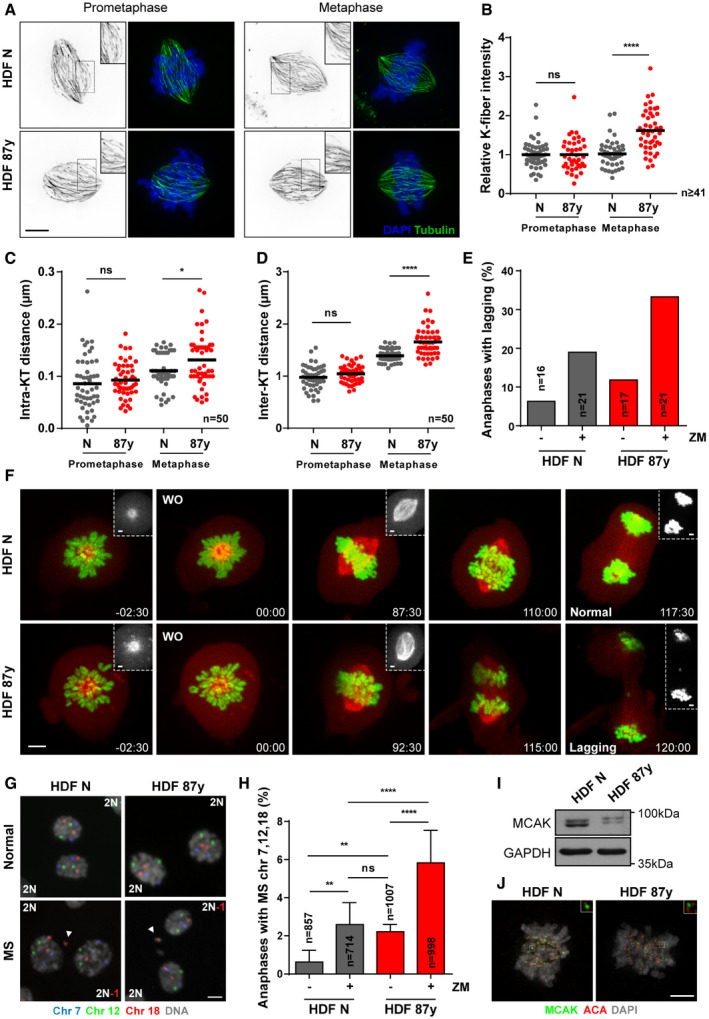
Representative images (A) and quantification (B) of calcium‐stable k‐fiber intensity levels by immunofluorescence analysis of n ≥ 41 tubulin‐stained mitotic cells of neonatal (N) and elderly (87 years) human dermal fibroblasts (HDF) at prometaphase and metaphase stages. Intensity levels were normalized to neonatal samples. Scale bar, 5 μm.
-
C
Intra‐kinetochore distance (between Hec1 and ACA immunostainings of a kinetochore) in n = 50 kinetochore pairs scored from 10 elderly versus neonatal cells in prometaphase and metaphase.
-
D
Inter‐kinetochore distance (between Hec1 staining of sister kinetochores) in n = 50 kinetochore pairs scored from 10 elderly versus neonatal cells in prometaphase and metaphase.
-
E, F
Live‐cell imaging of neonatal (N) and elderly (87 years) fibroblasts expressing H2B–GFP/α‐Tubulin‐mCherry treated with kinesin‐5 inhibitor (STLC) to induce monopolar spindles, followed by washout (WO) into medium with DMSO (−) or ZM447439 (+; 500 nM). (E) Quantification of anaphases with lagging chromosomes in n = cells scored and (F) representative movie frame series of a young and an elderly dividing cell that underwent correct (Normal) and incorrect (Lagging) chromosome segregation, respectively. Time, min:sec. Scale bars: 5 μm (images) or 2 μm (insets).
-
G
Representative images of anaphases without (top) and with (bottom) mis‐segregation (MS), FISH‐stained for three chromosome pairs (7, 12, and 18). Arrowheads indicate micronuclei containing centromeric signal for chromosome 18. Scale bar, 10 μm.
-
H
Percentage of anaphases with MS in neonatal (N) versus elderly (87 years) n = cells scored by FISH analysis.
-
I
Western blot analysis of total MCAK protein levels in neonatal (HDF N) and elderly (HDF 87 years) fibroblasts. GAPDH is shown as loading control.
-
J
Immunofluorescence analysis of MCAK levels in neonatal (HDF N) and elderly (HDF 87 years) mitotic cells. Scale bar, 5 μm.
Data information: All values shown are mean ± SD of at least two independent experiments. ns
< 0.0001 by two‐tailed (B–D) Mann–Whitney test and (H) chi‐square test.

