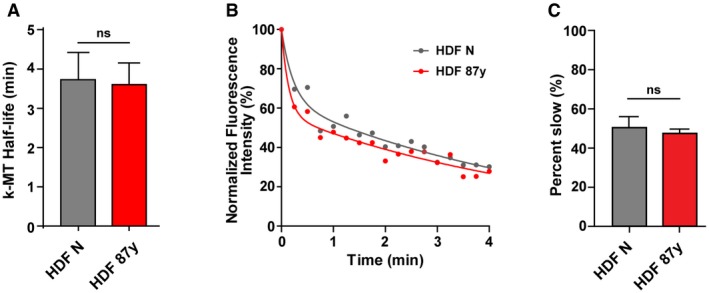
Figure EV1. Similar k‐MT detachment rates in young and elderly fibroblasts (related to Fig 1).

-
AAverage k‐MT half‐life for n = 12 neonatal (HDF N) and elderly (HDF 87 years) metaphase cells expressing mEOS‐Tubulin.
-
BExamples of normalized fluorescence dissipation after photoconversion in neonatal versus 87 years metaphase cells that are representative of the average k‐MT half‐life shown in (A).
-
CPercentage of photoconverted fluorescence intensity attributable to the slow decay process for n = 12 neonatal versus 87 years cells.
