-
A
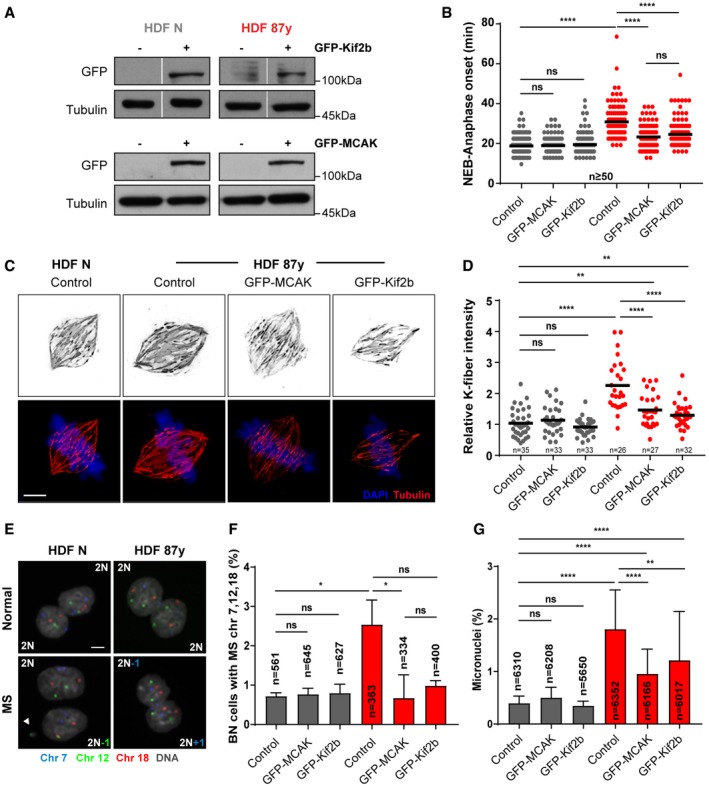
GFP protein levels in FACS‐sorted neonatal (N) and elderly (87 years) fibroblasts transduced with empty (control, −), GFP‐MCAK (+), and GFP‐Kif2b (+) lentiviral plasmids. Tubulin is shown as loading control.
-
B
Mitotic duration scored by time‐lapse phase‐contrast microscopy of n ≥ 50 cells per condition measured from nuclear envelope breakdown (NEB) to anaphase onset.
-
C, D
Representative images (C) and quantification (D) of calcium‐stable k‐fiber intensity levels by immunofluorescence analysis of n ≥ 26 tubulin‐stained metaphase cells transduced as indicated. Levels were normalized to the control neonatal sample. Scale bar, 5 μm.
-
E
Representative images of cytochalasin D‐induced binucleated (BN) cells without (top) and with (bottom) mis‐segregation (MS), FISH‐stained for three chromosome pairs (7, 12, and 18). Scale bar, 10 μm.
-
F
Percentage of BN cells with MS in n = cells scored.
-
G
Percentage of micronuclei in n = cells analyzed.
Data information: All values are mean ± SD of at least two independent experiments. ns
P > 0.05, *
P < 0.05, **
P < 0.01, ****
P < 0.0001 by two‐tailed (B, D) Mann–Whitney and (F, G) chi‐square test.
Source data are available online for this figure.

