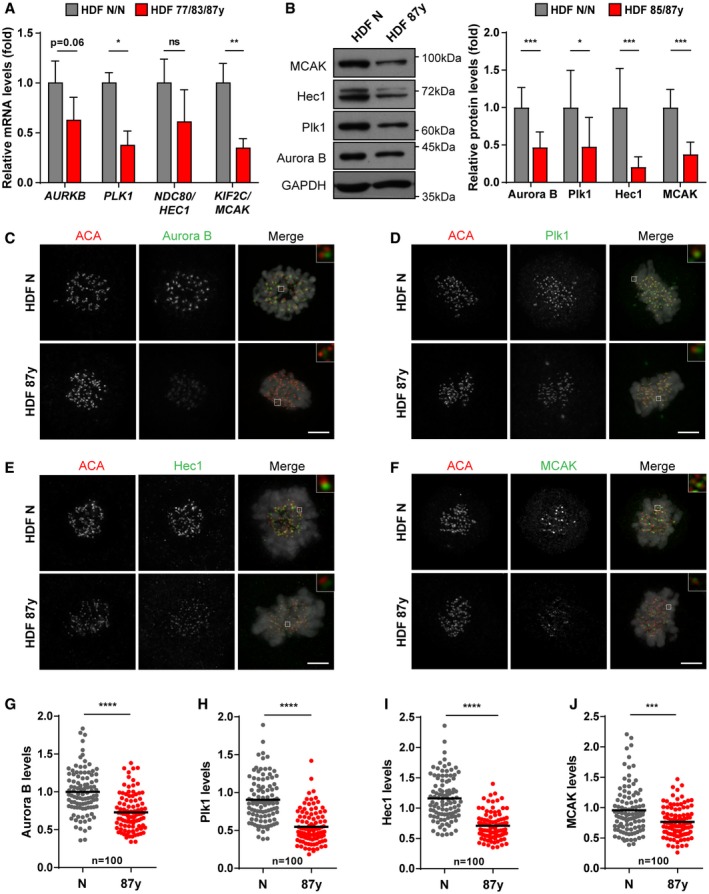
Figure EV2. Decreased levels of main regulators of k‐MT dynamics in mitotic cells from elderly donors (related to Fig 1).

-
ARelative AURKB, PLK1, HEC1, and MCAK transcript levels in total RNA of mitotic fibroblasts from elderly (HDF 77/83/87 years; n > 5 replicates) versus neonatal (HDF N/N; n ≥ 3 replicates) donors. TBP and HPRT1 were used as reference genes.
-
BWestern blot analysis (left) and quantification (right) of Aurora B, Plk1, Hec1, and MCAK protein levels in mitotic extracts of elderly (HDF 85/87 years; n ≥ 3 replicates per age) normalized against neonatal (HDF N/N; n = 5 replicates per neonatal sample) fibroblasts. GAPDH was used as loading control.
-
C–JRepresentative images and immunofluorescence intensity levels of (C, G) Aurora B, (D, H) Plk1, (E, I) Hec1, and (F, J) MCAK, in n = 100 kinetochores of mitotic cells (N versus 87 years). Intensity levels were normalized to ACA centromere staining. Scale bars, 5 μm.
