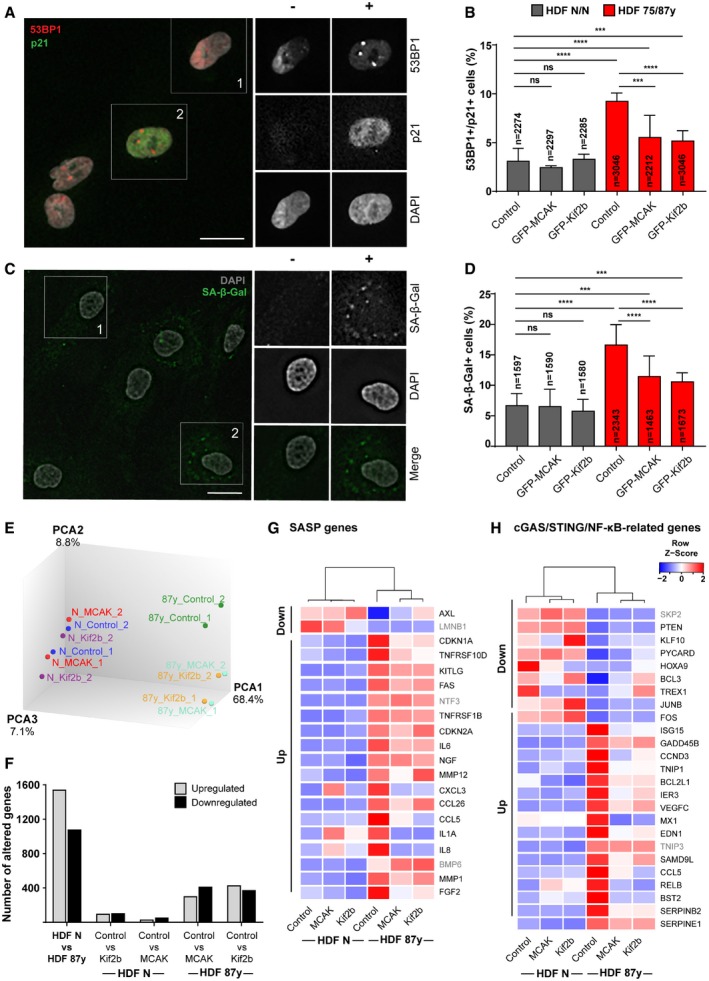
Figure 3. Overexpression of MCAK and Kif2b delays senescence in fibroblast cultures from elderly donors.

-
ARepresentative images of elderly cells scored as negative (−) or positive (+) for Cdkn1a/p21 (cell cycle inhibitor) and 53BP1 (≥ 1 foci; DNA damage) senescence biomarkers. Scale bar 20 μm.
-
BPercentage of n = cells staining double‐positive for Cdkn1a/p21 and 53BP1 in neonatal (N/N) and elderly (75/87 years) human dermal fibroblasts (HDF) transduced with empty, GFP‐MCAK or GFP‐Kif2b lentiviral plasmids.
-
CRepresentative images of elderly cells scored as negative (−) or positive (+) for SA‐β‐galactosidase (SA‐β‐gal) activity. Scale bar, 20 μm.
-
DPercentage of n = cells positive for SA‐β‐gal in neonatal and elderly HDFs transduced with empty, GFP‐MCAK or GFP‐Kif2b lentiviral plasmids.
-
EPrinciple component analysis (PCA) of neonatal and elderly cells transduced with empty‐vector (control) or kinesin‐13 proteins (MCAK or Kif2b) based on bulk RNA expression data.
-
FTotal number of genes altered (up‐ or downregulated, as indicated) for the comparisons shown between control and kinesin‐13‐overexpressing young (HDF N) and/or aged (HDF 87 years) cells.
-
G, HHeatmaps of differentially expressed (G) SASP and senescence genes, and (H) cGAS/STING/NF‐κB‐related genes of neonatal and 87 years HDFs. Down and Up refer to the expected changes as reported for senescent cells (Datasets EV2 and EV4). Gene symbols highlighted in gray indicate genes that were not modulated by overexpression of kinesin‐13 proteins. Z‐score row color intensities indicate higher (red) to lower (blue) expression.
