-
A
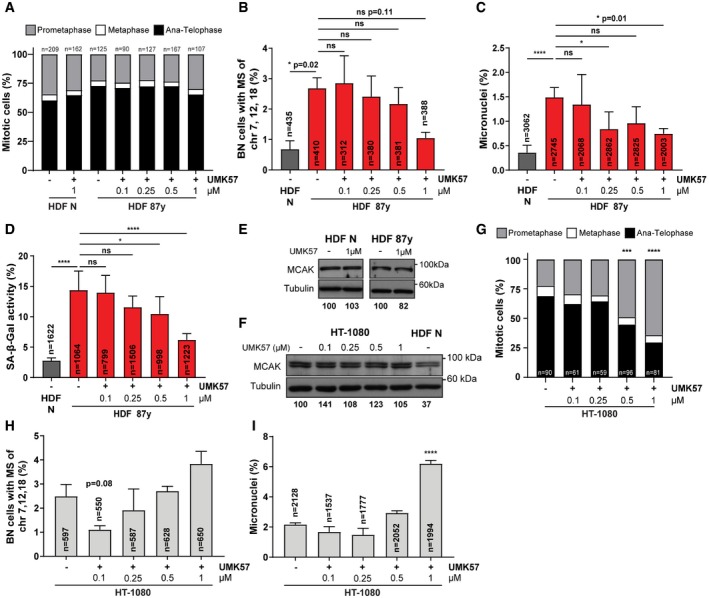
Percentage of n = mitotic cells of neonatal (N) and elderly (87 years) human dermal fibroblast (HDF) cultures in prometaphase, metaphase, or ana‐telophase upon 24 h of exposure to DMSO (−) or increasing concentrations of UMK57 (+) as indicated.
-
B
Cytochalasin D‐induced binucleated (BN) cells with mis‐segregation (MS) of chromosomes 7, 12, and 18 in neonatal (HDF N) and elderly samples (HDF 87 years) after 24‐h treatment with DMSO (−) or increasing concentrations of UMK57 (+) as indicated.
-
C
Percentage of micronuclei in neonatal (N) and elderly (87 years) n = cells treated with DMSO (−) or increasing concentrations of UMK57 (+) as indicated for 24 h.
-
D
Percentage of neonatal versus 87 years n = cells staining positive for SA‐β‐gal activity upon 24‐h treatment with DMSO (−) or increasing concentrations of UMK57 (+) as indicated.
-
E
Western blot analysis of MCAK protein levels in mitotic extracts of neonatal (HDF N) and elderly (HDF 87 years) fibroblasts following treatment with DMSO (−) or 1 μM UMK57 (+). Tubulin is shown as loading control.
-
F
Western blot analysis of MCAK protein levels in mitotic extracts of HT‐1080 cells or neonatal fibroblasts treated with DMSO (−) or increasing concentrations of UMK57 (+) for 24 h, as indicated. Tubulin is shown as loading control.
-
G
Percentage of n = HT‐1080 mitotic cells in prometaphase, metaphase, or ana‐telophase upon 24‐h treatment with DMSO (−) or increasing concentrations of UMK57 (+) as indicated.
-
H
Percentage of binucleated (BN) HT‐1080 cells with mis‐segregation (MS) of chromosomes 7, 12, and 18 upon 24‐h treatment with DMSO (−) or increasing concentrations of UMK57 (+) as indicated.
-
I
Percentage of micronuclei in n = HT‐1080 cells following 24‐h treatment with DMSO (−) or increasing concentrations of UMK57 (+) as indicated.
Data information: All values shown are mean ± SD of at least two independent experiments. ns
< 0.0001 by two‐tailed chi‐square test.

