-
A
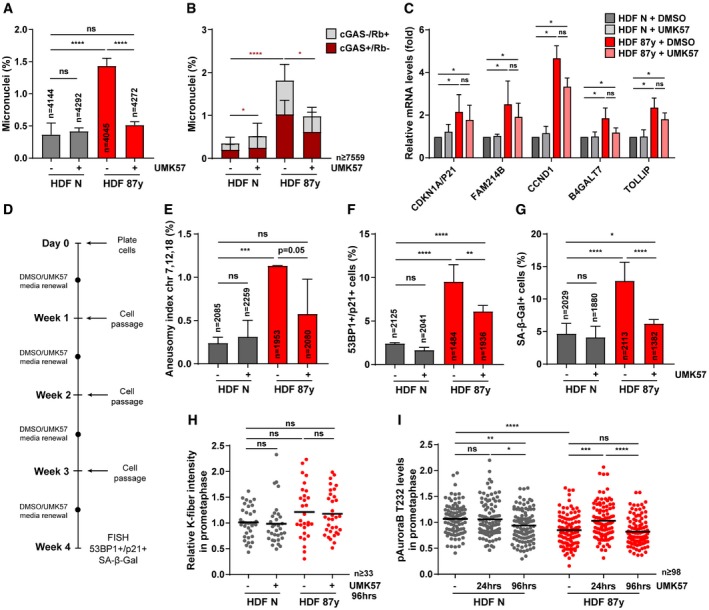
Percentage of micronuclei in n = cells of neonatal versus elderly samples after 96‐h treatment.
-
B
Percentage of cGAS+/Rb− and cGAS−/Rb+ micronuclei in n = cells scored by immunofluorescence analysis upon 96‐h treatment.
-
C
Relative CDKN1A/P21, FAM214B, CCND1, B4GALT7, and TOLLIP transcript levels in total RNA of neonatal (HDF N; n = 5 replicates) and elderly (HDF 87 years; n = 3 replicates) fibroblasts treated with DMSO or UMK for 96 h. TBP and HPRT1 were used as reference genes. All levels were normalized to DMSO‐treated neonatal sample.
-
D
Experimental layout for prolonged exposure to UMK57 of neonatal (N) and elderly (87 years) fibroblast cultures, with cell passage every week and media renewal halfway each week. At week 4, chromosome segregation and senescence biomarkers were analyzed.
-
E
Aneusomy index of chromosomes 7, 12, and 18 measured by interphase FISH in n = cells.
-
F
Percentage of n = cells staining positive for double immunostaining of Cdkn1a/p21 (cell cycle inhibitor) and 53BP1 (≥ 1 foci; DNA damage) senescence biomarkers.
-
G
Percentage of n = cells staining positive for SA‐β‐gal activity.
-
H
Calcium‐stable k‐fiber intensity levels scored by immunofluorescence analysis of n ≥ 33 tubulin‐stained mitotic cells in prometaphase of neonatal and elderly samples treated with DMSO (−) and UMK57 (+) for 96 h. Levels were normalized to neonatal DMSO‐treated condition.
-
I
Phospho‐Aurora B Thr232 (pAuroraB T232) levels at kinetochores/centromeres of neonatal and elderly prometaphase cells treated with DMSO (−) or UMK57 (+) for 24 or 96 h. Intensity levels were normalized to ACA.
Data Information: All values are mean ± SD of at least two independent experiments. ns
< 0.0001 by two‐tailed (A, B, E–G) chi‐square and (C, H, I) Mann–Whitney tests.

