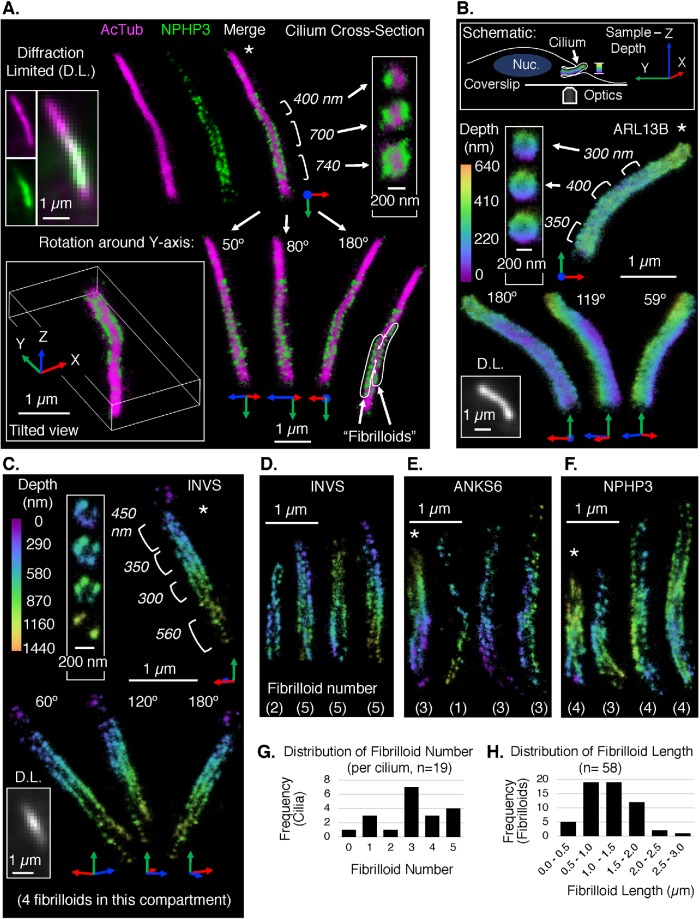
FIGURE 2:
3D SM SR reconstructions of the INVc and other ciliary markers. All localizations in the reconstructions are represented by 3D Gaussians with diameter 25 nm and an opacity set to show the localization density. Cilia are generally oriented tip up. Asterisks (*) indicate reconstructions for which supplemental movies and reconstruction statistics are provided (Supplemental Movies 1–4 and Supplemental Figures S18 and S19). (A) Two-color 3D SM SR reconstruction of a cilium immunolabeled with anti-NPHP3 to detect the INVc (AF647 secondary, green) and anti-acetylated tubulin to detect the axoneme (AcTub, CF568 secondary, magenta). Multiple views of the same cilium are shown, including diffraction-limited (D.L.) images of each channel separately and a merge (top left), SM SR reconstructions of each channel and a merge (top middle), rotated and tilted views of the merge (bottom), and cross-sections of three different regions of the INVc (top right). Cross-sections: the position and length of each region are annotated to the left of its corresponding cross-section. Rotated and tilted views: the XYZ-axes accompanying each reconstruction are defined by the position of the sample relative to the microscope, where the Z-axis represents sample depth as illustrated in the schematic in panel B. The “tilted view” is a tilted perspective viewing along the ciliary axis from ciliary tip (foremost) to base. The other three views (bottom right) are rotations of the reference image (connected by white arrows) around the Y-axis only. The degree of rotation is noted at the ciliary tip and is illustrated by the axes pinned to the ciliary base. The INVc (NPHP3) in this cilium appears to contain two linear substructures, “fibrilloids,” which are traced on a duplication of the 180° Y-rotation view (bottom right corner). (B–F) Single-color 3D SM SR reconstructions of ciliary proteins immunolabeled with specific primary antibodies and AF647-conjugated secondary antibodies. The color of each localization in the reconstruction maps to its Z-position in the sample. The depth range of the color scale is unique to each reconstruction. The 0 position (purple) is the edge of the reconstruction volume closest to the coverslip, not a fixed position relative to the sample stage. (B) Top: schematic defining the XYZ-axes of the sample, the coverage of the depth color scale used in single-color 3D SM SR reconstructions, and the relative orientations of the microscope objective (“Optics”), the coverslip, and an RPE1 cell with a cilium and nucleus (“Nuc.”) Objects are not drawn to scale. Bottom: 3D SM SR reconstruction of a cilium stained with anti-ARL13B to detect a ciliary protein independent of the INVc. Multiple views of the same cilium are shown (as in A): a D.L. image, cross-sections, and Y-axis rotations. (C) 3D SM SR reconstruction of a cilium stained with anti-INVS to detect the inversin compartment. Multiple views of the same cilium are shown (as in A and B): a D.L. image, cross-sections, and Y-axis rotations. The compartment in this reconstruction has four fibrilloids. (D–F) 3D SM SR reconstructions of multiple INVcs detected with either anti-INVS (D), anti-ANKS6 (E), or anti-NPHP3 (F). A single view of each cilium is shown (four cilia per panel, total 12 unique cilia in D–F). The number of fibrilloids counted in each reconstruction is noted at the bottom. (G) Distribution of the number of fibrilloids per cilium observed in 3D SM SR reconstructions of INVcs detected by immunolabeling for INVS, ANKS6, or NPHP3. Reconstructions of these INVcs are shown in panels C–F and Supplemental Figure S21, F–H. (H) Distribution of the lengths of individual fibrilloids measured in INVcs detected by INVS, ANKS6, or NPHP3 (as in G). From reconstructions of 18 compartments, a total of 58 fibrilloids were measured. The afibrilloid compartment in Supplemental Figure S21G is excluded from this graph.

