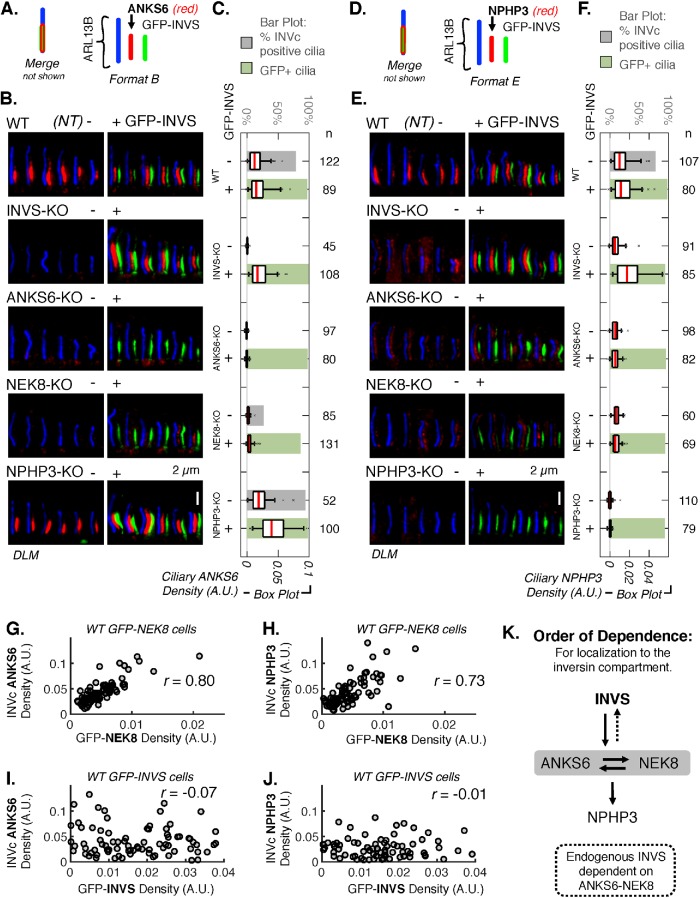
FIGURE 4:
ANKS6 and NEK8 link NPHP3 to INVS. (A) Schematic illustrating the coloring and relative positioning of fluorescent markers in the images in B. (B) DLM of ANKS6 detected by IF (AF568 secondary, red) in WT, INVS-KO, ANKS6-KO, NEK8-KO, and NPHP3-KO cell lines stably expressing GFP-INVS. GFP-INVS was detected by native GFP fluorescence (green). ARL13B (AF647 secondary, blue) marks the whole cilium. Additional images are provided in Supplemental Figure S32. (C) Mean ANKS6 density, measured as mean pixel intensity of the red channel in the ciliary region defined by ARL13B (arbitrary units, A.U.) in WT, INVS-KO, ANKS6-KO, NEK8-KO, and NPHP3-KO cell lines either not transduced (NT,-) or stably expressing GFP-INVS (+). Number of cilia (n) measured for each condition is noted to the right. See Supplemental Figure S34A for results of pairwise t tests performed for each sample represented in these plots. Supplemental Figure S32F provides INVc-specific density measurements. (D) Schematic illustrating the coloring and relative positioning of fluorescent markers in the images in E. (E) DLM of NPHP3 detected by IF (AF568 secondary, red) in WT, INVS-KO, ANKS6-KO, NEK8-KO, and NPHP3-KO cell lines stably expressing GFP-INVS. GFP-INVS detected by native GFP fluorescence (green). ARL13B (AF647 secondary, blue) marks the whole cilium. Additional images are provided in Supplemental Figure S33. (F) Mean ciliary intensity of NPHP3 in WT, INVS-KO, ANKS6-KO, NEK8-KO, and NPHP3-KO cell lines stably expressing GFP-INVS. Number of cilia (n) measured for each sample noted. See Supplemental Figure S34B for results of pairwise t tests performed for each sample represented in these plots. Supplemental Figure S32F provides INVc-specific density measurements. (G–J) Scatterplots and pairwise correlations of GFP-NEK8 or GFP-INVS (X-axis) with ANKS6 and NPHP3 (Y-axis) in WT RPE1 cells stably expressing GFP-NEK8 or GFP-INVS (see Supplemental Figure S36 for similar measurements for NEK8-KO cells rescued with GFP-NEK8 and INVS-KO cells rescued with GFP-INVS). GFP-NEK8 and GFP-INVS were detected directly by native GFP fluorescence and endogenous ANKS6 and NPHP3 were detected by indirect IF with AF568 secondary (as in B and E). The densities of the GFP-alleles and endogenous proteins within the INVc were measured as the mean pixel intensity in arbitrary units (A.U.) within a user-defined subcompartment mask drawn around the GFP and/or AF568-positive region of each cilium. (G) Correlation between ANKS6 and GFP-NEK8, n = 79, Pearson’s r value: r = 0.804 (p = 4.81 × 10⁻¹⁹). (H) Correlation between NPHP3 and GFP-NEK8, n = 79, Pearson’s r value: r = 0.726 (p = 2.62 × 10⁻¹⁵). (I) Correlation between ANKS6 and GFP-INVS, n = 86, Pearson’s r value: r = -0.0743 (p = 0.497). (J) Correlation between NPHP3 and GFP-INVS, n = 78, Pearson’s r value: r = -0.0139 (p = 0.904). (K) Diagram of hierarchical order of dependence for the localization of INVS, ANKS6, NEK8, and NPHP3 in the INVc, determined by IF of each INVc protein in gINVc-KO cells and gINVc-KO cells rescued with GFP-INVS.

