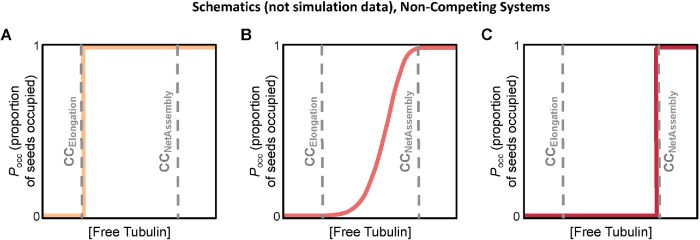
FIGURE 11:
Hypothetical Pocc vs. [free tubulin] curves, where Pocc is the proportion of seeds that are occupied by MTs. It might have been expected that GTP-like seeds should start growing once [free tubulin] is above CCElongation, and that Pocc would therefore increase abruptly from 0 to 1 for [free tubulin] at or just above CCElongation, similarly to the step function in panel A. In contrast, sigmoidal Pocc curves, similar to panel B, have been observed experimentally (Mitchison and Kirschner, 1984b; Walker et al., 1988; Dogterom et al., 1995; Wieczorek et al., 2015). Obtaining a sigmoidal shape (B) instead of a step function (A) has been interpreted as evidence of a nucleation process that makes growth of MTs from stable seeds more difficult than extension from a growing end (e.g., Wieczorek et al., 2015). However, as discussed in the text, this sigmoidal shape can be a consequence of DI in combination with experimental length-detection limitations, and therefore is not necessarily evidence of a nucleation process. Note that a nucleation process that makes growth from seeds more difficult would lead to a Pocc curve that increases more rapidly from 0 to 1 and does so at [free tubulin] near CCNetAssembly, similarly to the step function in panel C. This behavior can be explained in the following way. When [free tubulin] is below CCNetAssembly, MTs will repeatedly depolymerize back to the seed. When nucleation from seeds is difficult, it will take longer for a new growth phase to initiate after each complete depolymerization; seeds will therefore remain unoccupied for longer times and the proportion of seeds in the population that are occupied at any particular time be will smaller. Thus, as the difficulty of nucleation increases, the shape of the Pocc curve would change from a sigmoid (as in panel B) to a step function at CCNetAssembly (as in panel C).

