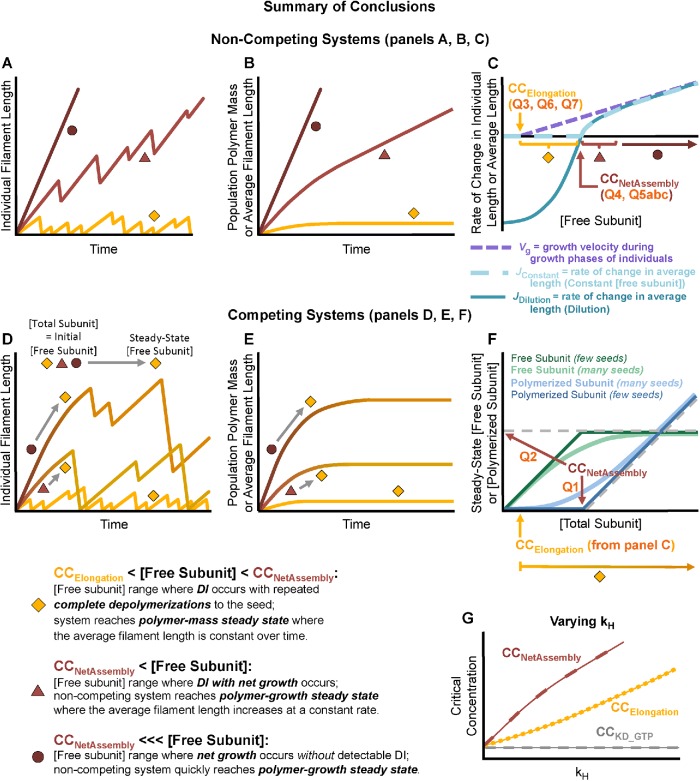
FIGURE 12:
Schematic summary of the relationships between DI behavior and CCs for DI polymers. First row: noncompeting systems ([free subunit] is held constant over time). Second row: competing systems ([total subunit] is held constant over time). Symbol key at bottom left. CCs and Q values are summarized in Tables 3 and 4. (A, D) Length histories of individual filaments in systems with three different values of [free subunit] (panel A) or [total subunit] (panel D). (B, E) The polymer mass or average filament length of populations containing the individuals in panels A or D as indicated by the corresponding symbols (similar to Supplemental Figures S3, A and B, and S1, C and D, respectively). (C) Rate of polymerization/depolymerization vs. [free subunit] for individual filaments during growth phases (Vg) and populations of filaments (JConstant, JDilution). More specifically, the panel shows 1) the growth velocity of individual filaments during the growth phase (Vg, purple dashed line; similar to Figure 7); 2) the net rate of change in average filament length of a population of filaments as assessed from experiments with [free subunit] held constant for the entire time of the experiment (JConstant, light turquoise dashed curve; similar to Figure 5, C–F); and 3) the net rate of change in average filament length of a population of filaments as assessed from dilution experiments (JDilution, dark turquoise solid curve; similar to Figure 6). Notice that JConstant and JDilution are superimposed for any [free subunit] > CCNetAssembly, and that these two curves approach Vg for [free subunit] >>> CCNetAssembly. (F) Emergent [free subunit] (green) or [polymerized subunit] (blue) as functions of input [total subunit] for competing systems at polymer-mass steady state (similar to Figures 3, A and B, and 4). (G) Effect of changing kH, the rate constant for nucleotide hydrolysis (similar to Figure 9G). Interpretations:
Behavior of individual filaments for [free subunit] below and above CCNetAssembly: In both competing and noncompeting systems, when [free subunit] is between CCElongation and CCNetAssembly, individual filaments display steady-state DI in which they eventually and repeatedly depolymerize back to the seed (panels A and D, diamond symbols). When [free subunit] is above CCNetAssembly, individual filaments display net growth over time, while still undergoing DI (panel A, triangle symbol) except perhaps at very high concentrations (panel A, circle symbol).
•Behavior of individual filaments in competing systems over time: If initial [free subunit] > CCNetAssembly in a competing system, then individual filaments initially experience net growth (panel D, triangle and circle symbols). Because [total subunit] is constant in competing systems, [free subunit] decreases as subunits polymerize. Net growth of individual filaments continues until [free subunit] drops below CCNetAssembly.
•Polymer-mass and polymer-growth steady states: Given sufficient time, competing systems reach polymer-mass steady state, where the average filament length (panel E), the population’s [polymerized subunit] (panels E and F), and [free subunit] (panel F) have finite steady-state values governed by the input [total subunit]. In noncompeting systems, polymer-mass steady state is reached only if [free subunit] is below CCNetAssembly (panel B, diamond symbol). In contrast, noncompeting systems with [free subunit] above CCNetAssembly reach polymer-growth steady state (panel B, triangle and circle symbols), where the average filament length increases at a constant rate J (panel C).
•Effect of number of stable MT seeds in competing systems: [Free subunit]SteadyState in competing systems does not equal CCNetAssembly but approaches CCNetAssembly as [total subunit] is increased, and the sharpness of the approach depends on the number of seeds (panel F; compare light and dark curves). In particular, for many seeds, [free subunit]SteadyState is noticeably below CCNetAssembly even at very high [total subunit].
•Varying kH: When kH = 0 (equilibrium polymer), there is one CC: CCKD_GTP = CCElongation = CCNetAssembly. When kH > 0 (steady-state polymer), CCElongation and CCNetAssembly are distinct from each other and from CCKD_GTP. At sufficiently low kH, CCElongation and CCNetAssembly would be experimentally indistinguishable. As kH increases, CCElongation and CCNetAssembly both increase, but CCKD_GTP does not change with kH. The [free subunit] range where DI with complete depolymerizations occurs, that is, the range between CCNetAssembly and CCElongation (bracket with diamond symbol in panel C), increases with kH.

