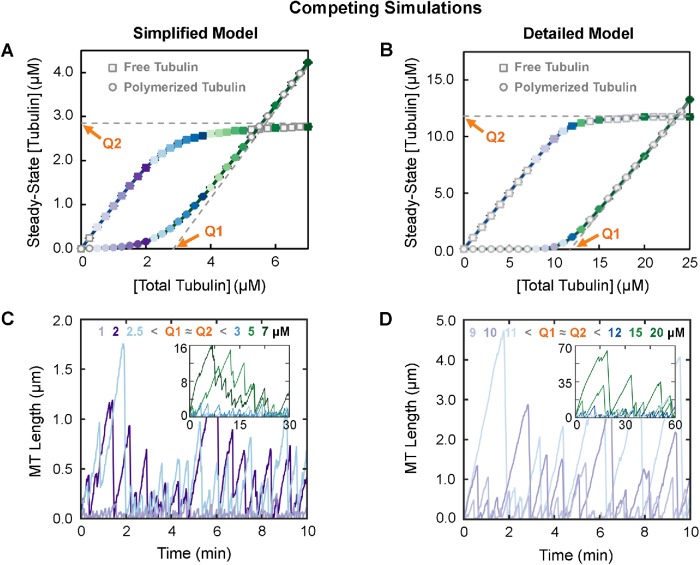
FIGURE 3:
Behavior of MTs (populations and individuals) under conditions of constant total tubulin. Left panels: simplified model; right panels: detailed model. Colors of data points reflect the concentrations of total tubulin. (A, B) Classical CC measurements (compare with Figure 1A). Systems of competing MTs at total tubulin concentrations as indicated on the horizontal axes were each allowed to reach polymer-mass steady state (shown in Supplemental Figure S1, A–D). Then the steady-state concentrations of free (squares) and polymerized (circles) tubulin were plotted as functions of [total tubulin]. (C,D) Representative length history plots for individual MTs from the simulation runs used in panels A and B. The value of [total tubulin] for each length history is indicated in the color keys at the top of panels C and D. Interpretation: Classically, Q1 estimates CCPolAssem, and Q2 estimates CCSubSoln. However, as can be seen in panels C and D, MTs grow in both models at [total tubulin] below Q1 ≈ Q2 (∼2.85 µM in the simplified model and ∼11.8 µM in the detailed model). Consistent with this observation, the main text provides justification for the idea that CC as estimated by Q1 ≈ Q2 instead measures CCNetAssembly, the CC for persistent growth of a population’s polymer mass and net growth of individual MTs over time. Note that the difference in the values of Q1 ≈ Q2 between the two models is expected from the fact that the input kinetic parameters for the models were chosen to produce quantitatively different DI measurements in order to provide a test of the generality of conclusions about qualitative behaviors; the results show that the behaviors are indeed qualitatively similar between the two models. For additional data related to the competing simulations (e.g., plots of [free tubulin] and [polymerized tubulin] as functions of time), see Supplemental Figure S1. Methods: Data points in panels A and B represent the mean ± one SD of the values obtained in three independent runs of the simulations. The values from each of three runs are averages over 15–30 min for the simplified model (panel 3A) and over 30–60 min for the detailed model (panel 3B). These time periods were chosen so that [free tubulin] and [polymerized tubulin] had reached their steady-state values (Supplemental Figure S1, A–D).

