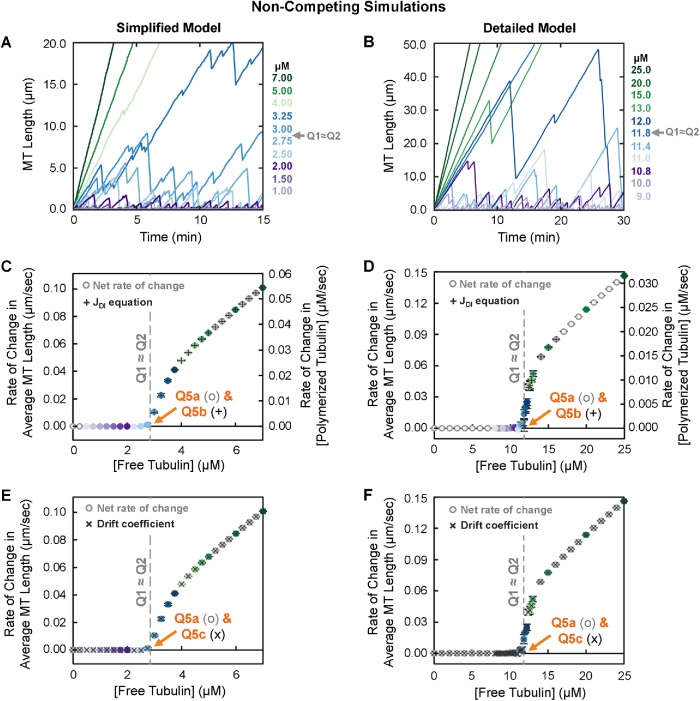
FIGURE 5:
Behavior of MTs (individuals and populations) under conditions of constant free tubulin. Left panels: simplified model; right panels: detailed model. Colors of data points reflect the concentrations of free tubulin. (A, B) Representative length history plots for one individual MT at each indicated constant free tubulin concentration. (C, D) Steady-state net rate of change (o symbols) in average MT length (left axes) or in concentration of polymerized tubulin (right axes) for the free tubulin concentrations shown. Q5a indicates the concentration at which this rate becomes positive. This panel also shows the theoretical rate of change in average MT length (+ symbols) as calculated from the extracted DI measurements (Supplemental Excel file) using the equation JDI = (Vg Fres – |Vs|Fcat)/(Fcat + Fres) in the [free tubulin] range where JDI > 0 (Eq. 1 in the “unbounded growth” regime) (Hill and Chen, 1984; Walker et al., 1988; Verde et al., 1992; Dogterom and Leibler, 1993). Q5b is the concentration at which JDI becomes positive. (E, F) Drift coefficient (Komarova et al., 2002) of MT populations as a function of [free tubulin] (x symbols). Q5c is the concentration above which drift is positive. For ease of comparison, the rate of change in average MT length (o symbols) from panels C and D is replotted in panels E and F, respectively. For additional data related to these simulations, see Supplemental Figure S3. Interpretation: The results show that Q5a ≈ Q5b ≈ Q5c, hereafter referred to as Q5. At concentrations below Q5, populations of MTs reach a polymer-mass steady state where the average MT length is constant over time (the rate of change in average MT length or polymer mass is approximately zero; panels C and D), and the system of MTs exhibits zero drift (panels E and F). At free tubulin concentrations above Q5, populations of MTs reach a polymer-growth steady state where the average MT length and polymer mass increase over time at constant average rates that depend on [free tubulin] (panels C and D), and the system of MTs exhibits positive drift (panels E and F). Plots of average MT length vs. time are shown in Supplemental Figure S3, A and B. Note that the concentration range below Q5 corresponds to the “bounded” regime as discussed by Dogterom et al., while that above Q5 corresponds to the “unbounded” regime (Dogterom and Leibler, 1993). The overall conclusions of the data in this figure are that 1) MTs exhibit net growth (as averaged over time or over individuals in a population) at [free tubulin] above the value Q5 (Q5a ≈ Q5b ≈ Q5c) and 2) Q5 is similar to the value Q1 ≈ Q2 (gray dashed line) as determined in Figure 3, A and B. Thus, Q1, Q2, and Q5 all provide measurements of the same CC, defined as CCNetAssembly in the main text. Methods: All population data points (panels C–F) represent the mean ± one SD of the values obtained in three independent runs of the simulations. In panels C and D, the net rate of change was calculated from 15 to 30 min. In panels E and F, the drift coefficient was calculated using a method based on Komarova et al. (2002) (Supplemental Methods). See also Supplemental Table S1B for a summary of the measurement methods used in panels C–F.

