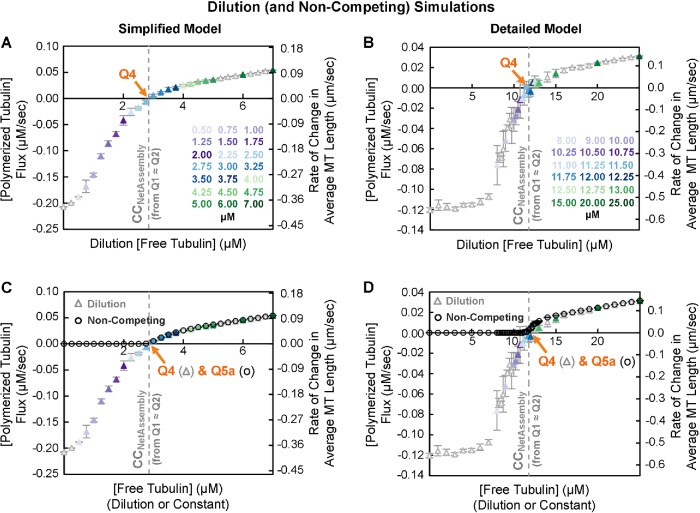
FIGURE 6:
Flux of tubulin subunits into and out of MT polymer as a function of dilution [free tubulin] (i.e., a J(c) plot as in Carlier et al., 1984a, b and Figure 1C). Left panels: simplified model; right panels: detailed model. (A, B) In the dilution simulations, competing systems of MTs at high [total tubulin] were allowed to polymerize until they reached polymer-mass steady state. The MTs were then transferred into (“diluted into”) the free tubulin concentrations shown on the horizontal axes. After a brief delay, the initial flux (rate of change in [polymerized tubulin] (left axes) or in average MT length (right axes)) was measured. (C, D) Data replotted to show that the J(c) curves from the dilution simulations (i.e., JDilution) in panels A and B (triangle symbols) and the net rate of change in average MT length from the constant [free tubulin] simulations (i.e., JConstant) in Figure 5, C and D (circle symbols), overlay each other for [free tubulin] above CCNetAssembly. Interpretation: These data show that CC as determined by Q4 from J(c) plots is approximately the same value as Q1 ≈ Q2 (gray dashed line), and thus Q4 also provides a measurement of CCNetAssembly. Methods: Competing systems of MTs at 22 µM total tubulin were allowed to reach polymer-mass steady state. Then, at minute 10 of the simulation in the simplified model and at minute 20 of the simulation in the detailed model, the MTs were transferred into the free tubulin concentrations shown on the horizontal axes. After a 5-s delay, the flux was measured over a 10-s period (see Supplemental Figure S4 for plots of [free tubulin] and [polymerized tubulin] as functions of time). Note that the delay after dilution was necessary in the original experiments because of instrument dead time, but it is important for obtaining accurate J(c) measurements because it allows the GTP cap size to respond to the new [free tubulin] (Duellberg et al., 2016; Bowne-Anderson et al., 2013; Mauro et al., 2019). For accurate measurements of J at low values of dilution [free tubulin], the predilution MTs should be sufficiently long so that none completely depolymerize during the 15-s period after dilution (Mauro et al., 2019). Data points for different concentrations of dilution [free tubulin] (see color key) represent the mean ± one SD of the values obtained in three independent runs of the simulations.

