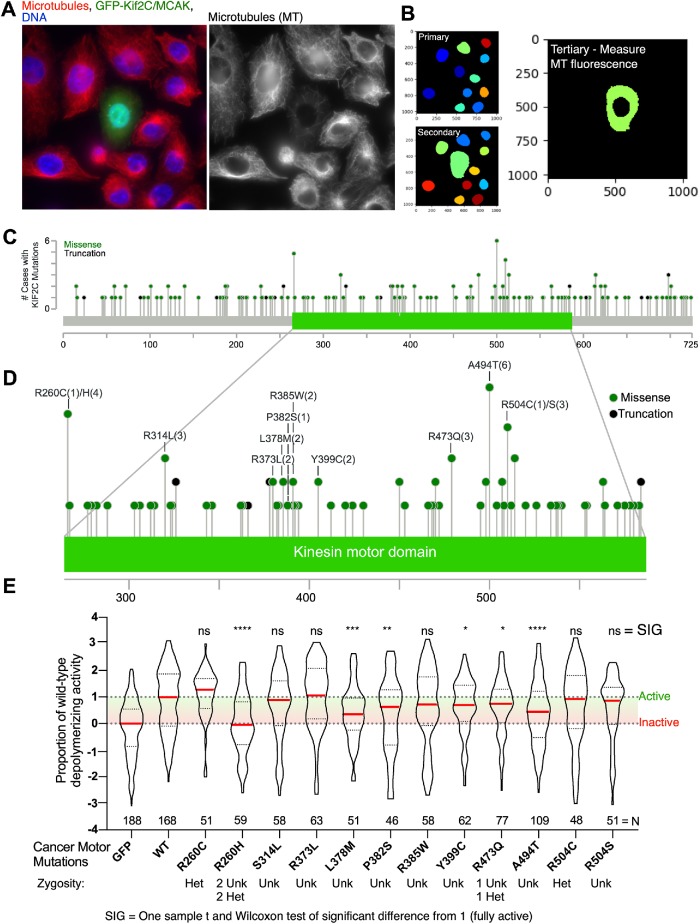
FIGURE 4:
CellProfiler improves the workflow for the analysis of MCAK/Kif2C cancer mutations. (A) A field of cells transfected with GFP-WT-MCAK/Kif2C. GFP, green; MTs, red; DNA, blue. (B) CellProfiler pipeline to analyze cytoplasmic tubulin levels in transfected cells. (C) Missense mutations and truncations mapped to full-length MCAK/Kif2C (cBioPortal). (D) Missense mutations that we engineered were biased toward hot spots (defined as more than two patients). (E) Proportion of MT-depolymerizing activity measured in engineered cancer mutations. N = successive 20× fields of cells containing between one and three transfected cells. Violin plots show the median activity (red line). *p < 0.05; **p < 0.01; ***p < 0.001; ****p < 0.0001.

