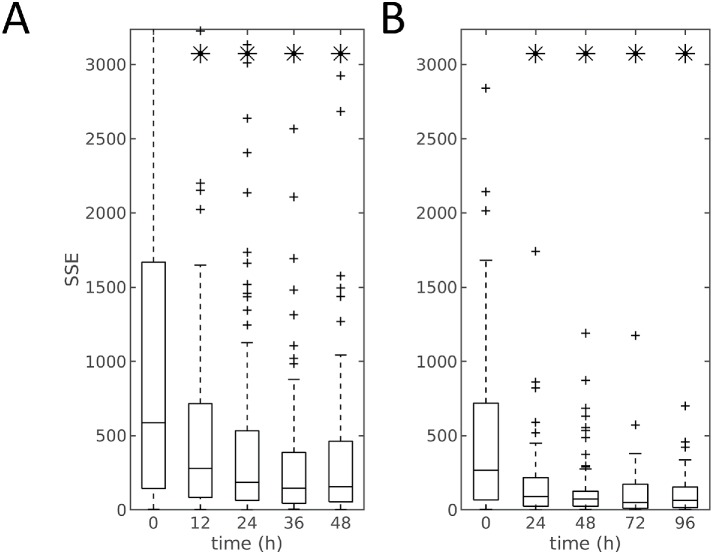
FIGURE 3:
Prediction error of mitochondrial localization parameters as a function of time for the model between shapes (without size) and mitochondria patterns. Panels A and B show the results for the 48- and 96-h dosing experiments, respectively. At each time point (x-axis) the central box mark indicates population median, and the lower and upper bounds of the box indicate 25th and 75th percentiles. Whisker bounds cover ∼95% of the data, with outliers shown in small crosses. An asterisk indicates that the error for that time point is statistically different from the error at the 0 h time point.

