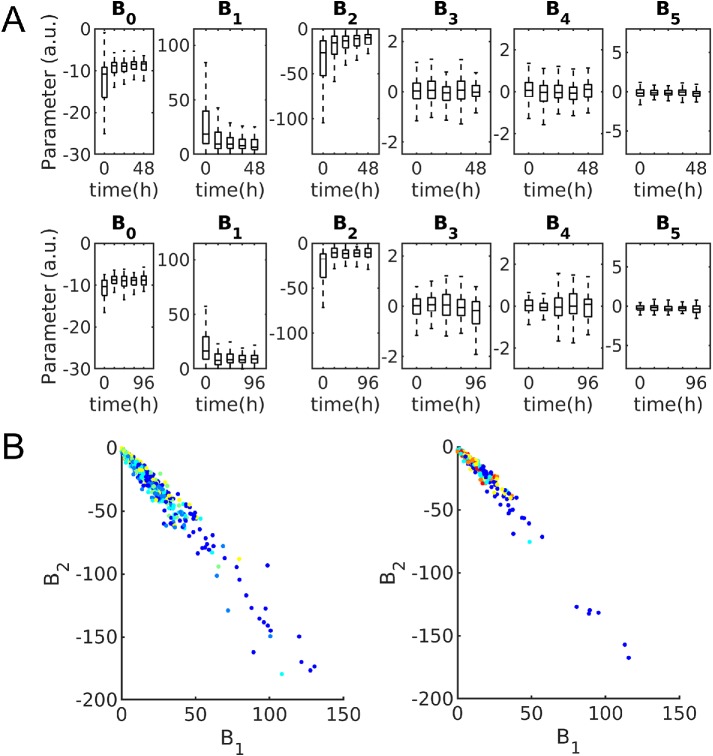
FIGURE 4:
Mitochondria distribution parameters. (A) Boxplots showing distribution of parameters for 48-h (top) and 96-h (bottom) experiments. Box centers indicate population median with bounds indicating 25th and 75th percentiles, respectively. Whiskers indicate 99% coverage of data. (B) Mitochondria distribution parameters corresponding most with time plotted against each other and colored by time for 48-h (left) and 96-h (right) experiments. Blue indicates untreated cells and warmer colors indicate later time points at either 12- or 24-h intervals.

