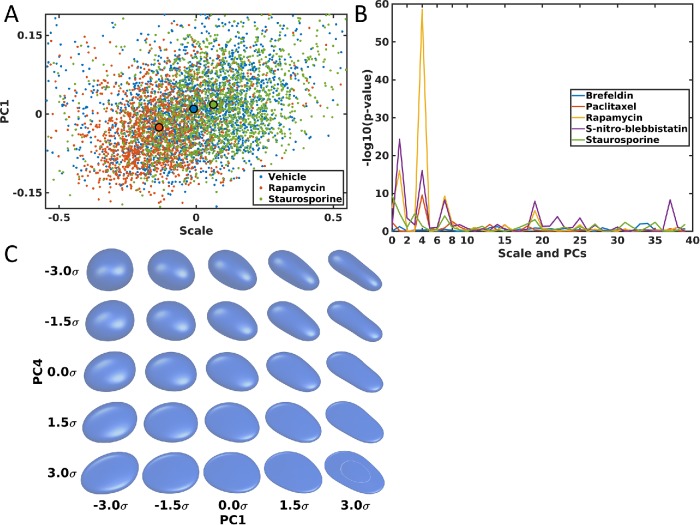
FIGURE 8:
Shape space and shape variances comparison of nuclear shapes for hiPSCs. (A) Nuclear shape spaces for vehicle (blue), rapamycin (red), and staurosporine (green). A large dot with a black boundary shows the centroid of shape distributions for each group. (B) p values of t tests between a drug and its vehicle for size (shown on the left) and the first 39 PCs (separately). (C) Shape variance visualization for PC1 and PC4 in the shape space. The variations in PC1 and PC4 are shown along the x-axix and y-axis, with different standard deviations (SDs) as indicated. The center shows the mean shape.

