FIGURE 3:

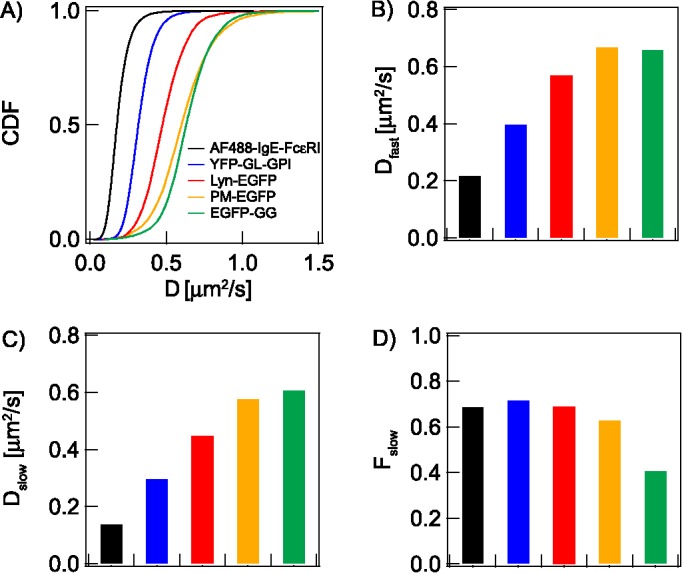
Diffusion parameters are determined from the statistical analyses of D CDF for lipid, lipid-anchored, and TM probes depicted in Figure 1B. (A) CDF of D values for indicated probes. Fitting of the respective CDFs yields: (B) Dfast: average diffusion coefficient of probes in Px unit population with less dynamic confinement (nanodomain-poor for lipid probes); (C) Dslow: average diffusion coefficient of probes in Px unit population with more dynamic confinement (nanodomain-rich for lipid probes); (D) Fslow: fraction of Px units exhibiting Dslow. Probes EGFP-GG, PM-EGFP, Lyn-EGFP, and YFP-GL-GPI are primarily subject to lipid-based interactions, whereas AF488-IgE-FcεRI (and other TM probes) depends on protein-based interactions. The color code in A identifies the probes in all panels. Numerical values of all parameters with defined errors are provided in Table 1. Because of very large data sets and robust statistics, all pairwise comparisons within each panel are significantly different (though the differences may be small): In B, PM-EGFP and EGFP-GG are different with p < 0.05, as determined by unpaired Student’s t test; all other comparisons within B and other panels A–D are different with p < 0.0001 (see Materials and Methods).
