FIGURE 5:
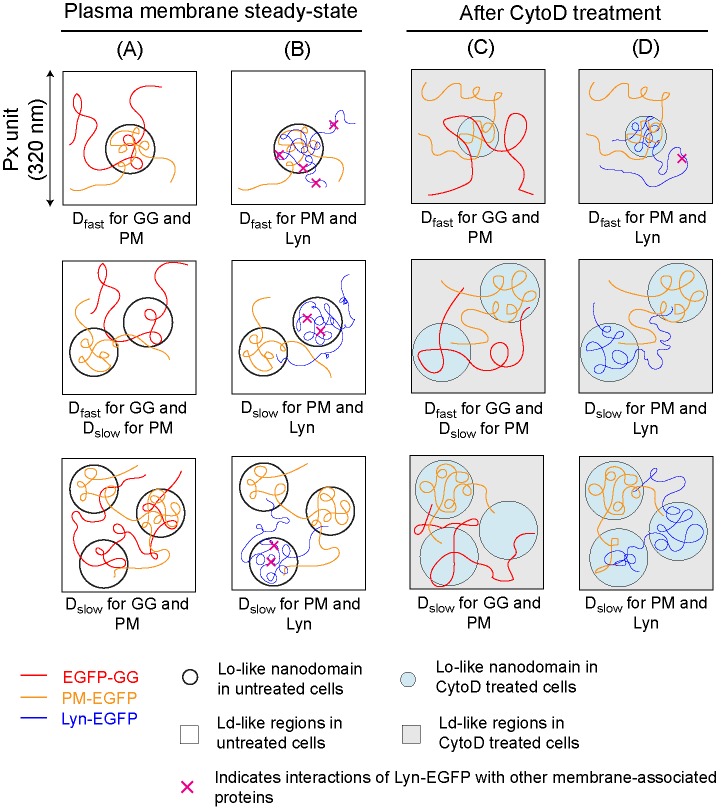
Diffusion of inner leaflet probes EGFP-GG, PM-EGFP, and Lyn-EGFP depends on lipid-based interactions inside and outside of Lo-like proteolipid nanodomains and is modulated by inhibition of actin polymerization. Representative Px units with low (top), moderate (middle), or high (bottom) levels of coverage by nanodomains (circles) are shown. EGFP-GG partitions less favorably into Lo-like environments so that this probe’s diffusion is less affected by the presence of the nanodomains and its Dfast corresponds to Px units with both low and moderate coverage; only Px with high levels of coverage manifest as Dslow for this probe. Dfast for PM-EGFP and Lyn-EGFP corresponds to Px units with low coverage by nanodomains, whereas Dslow for these probes corresponds to Px units with moderate and high levels of coverage. Diffusion of Lyn-EGFP is further retarded by interactions of its protein modules with other proteins in and out of nanodomains (indicated by × [pink]). Contrasting behavior of these probes is illustrated by their respective diffusion trajectories. PM-EGFP is compared with EGFP-GG (A) and to Lyn-EGFP (B) in resting steady state plasma membrane of RBL cells. Retardation of diffusion due to dynamic partitioning into nanodomains: Lyn-EGFP > PM-EGFP > EGFP-GG, as reflected by respective D CDFs and extracted D values (Figure 3), as well as relative τ0,av values determined for these probes (Table 1). (C, D) When resting cells are treated with 1 μM CytoD, the nanodomains become more ordered and probe interactions with membrane components change into and out of nanodomains, as reflected by their diffusion properties (Figure 4). Compared with untreated cells, EGFP-GG partitions less favorably into nanodomains, whereas PM-EGFP partitions more favorably, C. As reflected by τ0,av values, Lyn-EGFP loses interactions with proteins within nanodomains (absence of × inside nanodomains), behaving more like PM-EGFP in these regions, but gains interactions with proteins outside these regions (as reflected by Slopeav values), D. Differences in diffusion properties caused by CytoD treatment are also reflected in D CDFs (Supplemental Figure S4) and extracted D values (Table 1).

