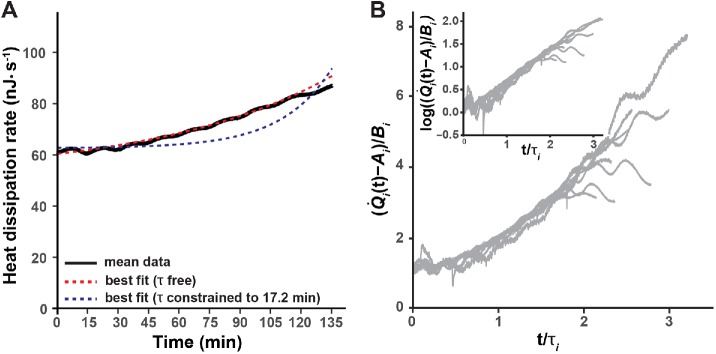
FIGURE 3:
The heat dissipation doubles approximately three times more slowly than the number of cells. (A) Least-squares fit of the heat dissipation curves to an exponential plus a constant, ( ). A, B, and τ are free parameters. The fits were done on the individual experimental curves (gray lines in Figure 1) and averaged (the red dotted line). The mean of the experimental heat dissipation curves is shown in black. The blue dotted curve is the least-squares fit with τ constrained to be equal to the average cell cycle time of 17.2 min with A and B free parameters. (B) The heat dissipation trajectories from 10 individual experiments (Qi (t), i = 1, …, 10) were rescaled by subtracting Ai and dividing by Bi plotted against time divided by τi. The superimposed curves illustrate the exponential rise, which is also apparent in the linear increase on a log-linear scale (inset).

