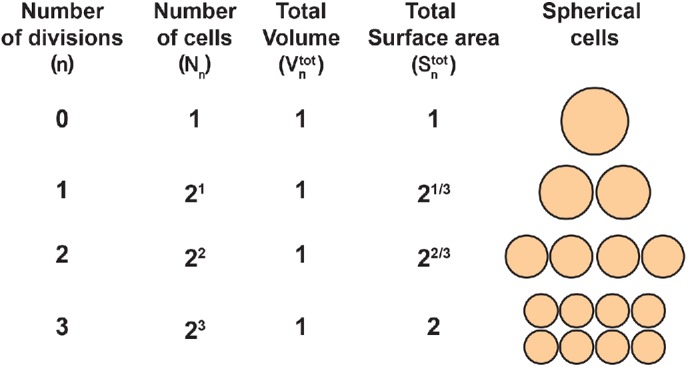
FIGURE 4:

Surface-area model assuming spherical cells with constant total volume. As the number of divisions (n) increases, the number of cells (Nn), depicted as spheres on the right, increases exponentially. The total embryonic volume ( ) remains constant throughout cleavage stage, and the total surface area (
 ) increases exponentially but three time slower than the number of cells. The model parameters and their initial values are defined in Table 2.
