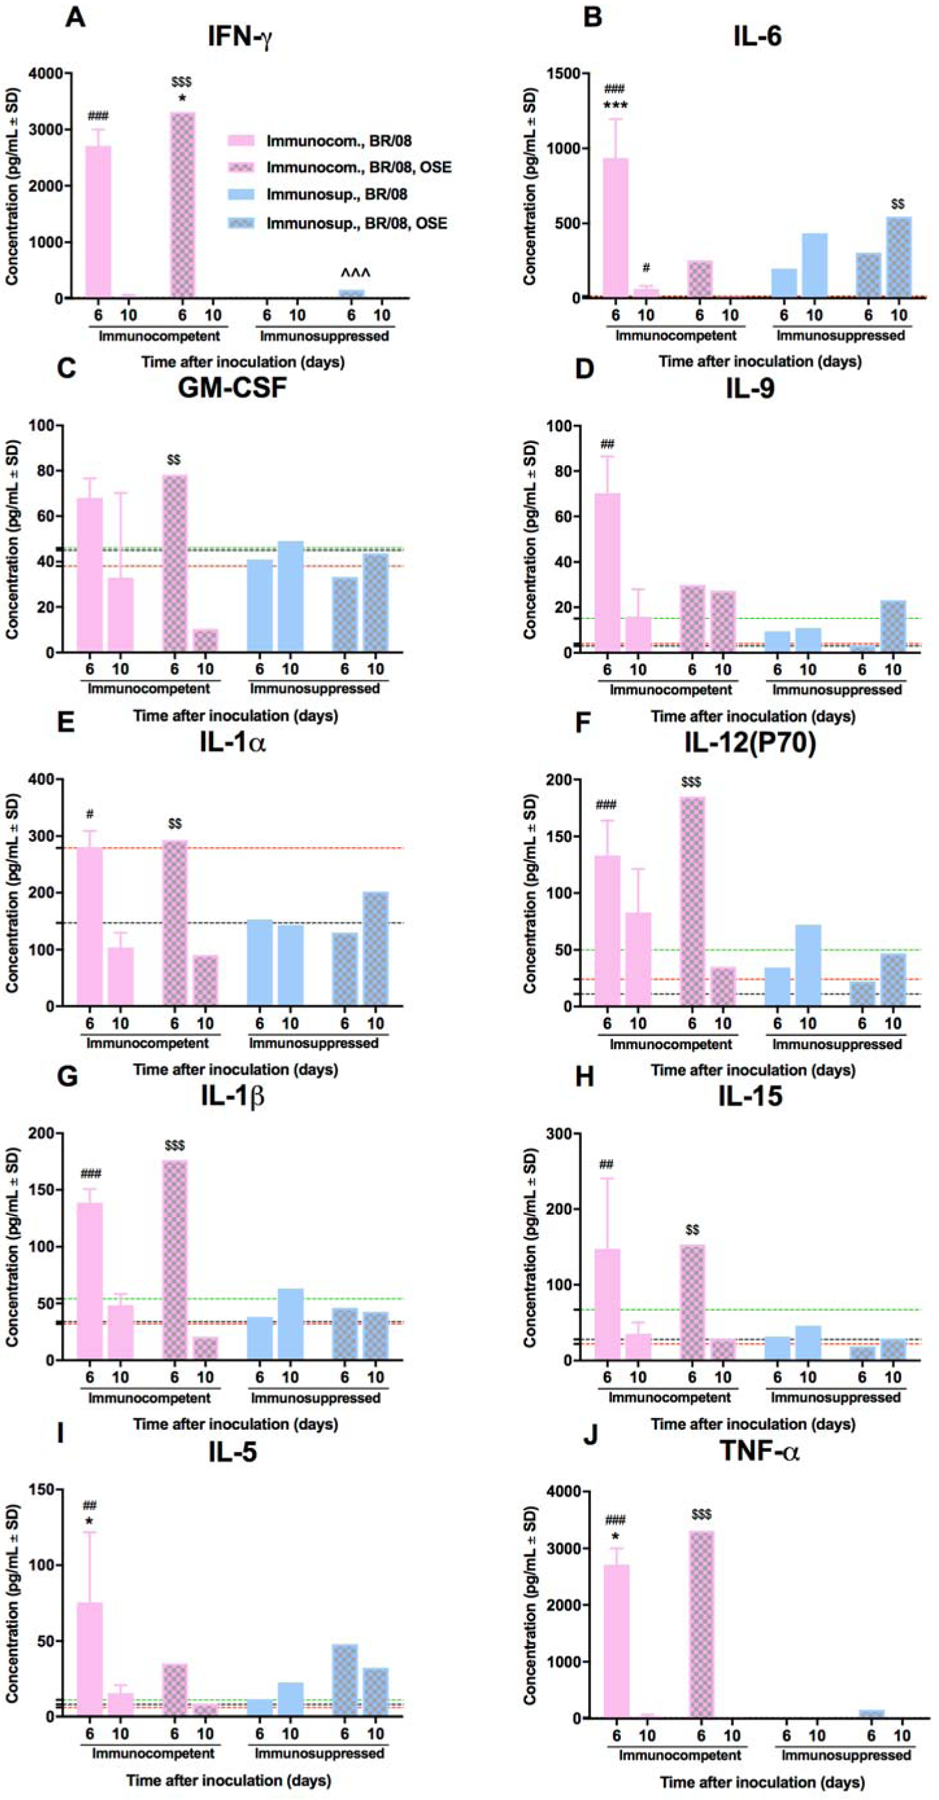
Figure 7. Pulmonary cytokine/chemokine responses in immunocompetent and immunosuppressed mice inoculated with influenza BR/08 virus and treated with oseltamivir.

Immunocompetent and immunosuppressed (DEX+CP-treated) BALB/c mice were anesthetized with isoflurane and inoculated intranasally with influenza BR/08 virus and treated with oseltamivir as described in the legend for Figure 6. The expression levels of IFN-γ (A), IL-6 (B), GM-CSF (C), IL-9 (D), IL-1α (E), IL-12(P70) (F), IL-1β (G), IL-15 (H), IL-5 (I), and TNF-α (J) were assayed in lung homogenates at 6 and 10 dpi. Bars represent mean values ± SDs (n = 3/group/time-point). *P < 0.05, **P < 0.01, and ***P < 0.001 for comparisons of untreated and oseltamivir-treated immunocompetent mice; ^^^P < 0.001 for comparison of untreated and oseltamivir-treated immunosuppressed mice; #P < 0.05, ##P < 0.01, and ###P < 0.001 for comparisons of untreated and DEX+CP–treated mice; and $$P < 0.01, and $$$P < 0.001 for comparison of oseltamivir-treated immunocompetent and immunosuppressed mice by one-way ANOVA with Bonferroni’s multiple comparison post-test. The level of cytokine/chemokine expression in control uninfected mice is indicated by a black dotted line for immunocompetent mice, by a red dotted line for immunosuppressed mice, and by a green dotted line for immunosuppressed, oseltamivir-treated mice.
