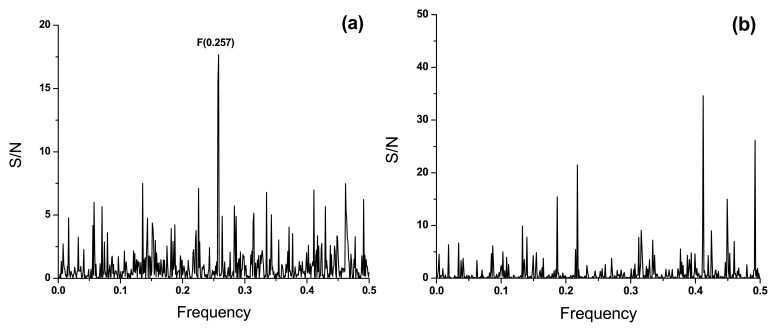
Figure 1. Cross-spectrum (CS) of S1 proteins.
( a) CS of S1 from SARS-CoV, MERS-CoV and SARS-CoV-2; ( b) CS of Bat SARS-like CoV and SARS-CoV-2. The abscissa represents the frequencies from the Fourier transform of the sequence of electron-ion interaction potential corresponding to the amino-acid sequence of proteins. The lowest frequency is 0.0 and the highest is 0.5. The ordinate represents the signal-to-noise ratio (the ratio between signal intensity at one particular IS frequency and the main value of the whole spectrum, S/N).

