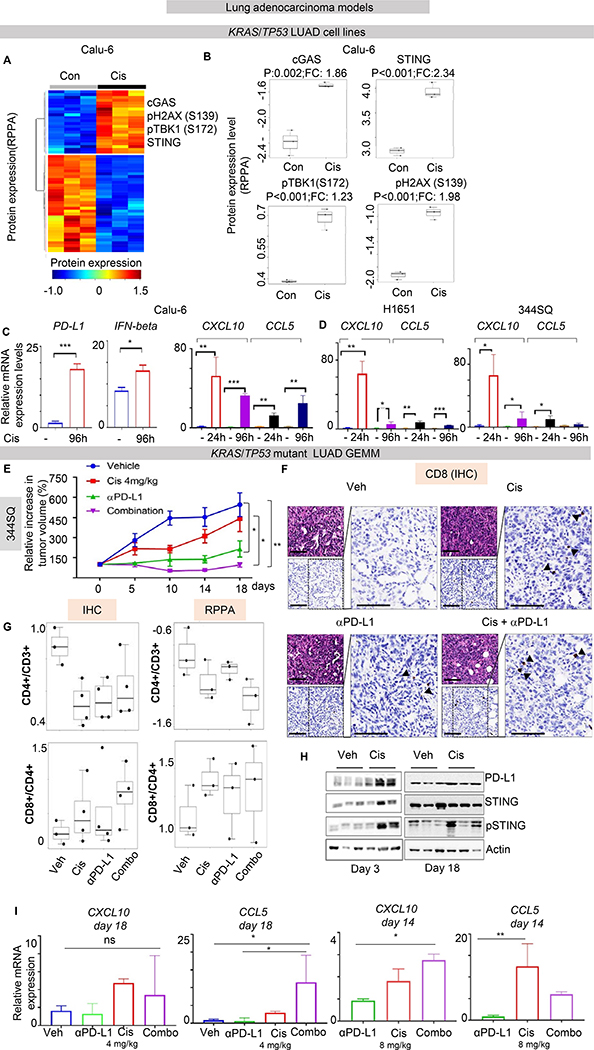
Figure 3. Cisplatin treatment activates STING pathway markers in NSCLC in vitro and in vivo.
(A-B) Supervised hierarchical clustering of protein expression profiles in untreated and cisplatin-treated LUAD cells Calu-6 (KRAS/TP53 mutant) shows upregulation of proteins in the STING pathway (STING, phospho-TBK1 (Ser_172), CGAS), PD-L1 and phospho-H2AX(Ser_139) following cisplatin treatment (p<0.01, by t-test). (C-D) Quantitative PCR (qPCR) measurement of PD-L1, CCL5, CXCL10 and IFNβ mRNA expression in three KRAS/TP53 mutant NSCLC cell lines treated with cisplatin for 24 and 96 hours. Data presented as mean ±SD and p values by t-test ***p<0.001, **p<0.01, *p<0.05.. (E) 344SQ tumor bearing mice were treated with vehicle, cisplatin (4 mg/kg, i.p., 1/7), anti-PD-L1 antibody (300μg, i.p., 1/7), or the combination. Relative tumor volumes (mean ± S.E.M.) are shown. The combination of cisplatin and anti-PD-L1 antibody significantly potentiated the anti-tumor response to either single agent (P values were calculated by ANOVA, followed by Tukey’s test. (F) Histological analysis of 344SQ tumors demonstrate the presence of CD8+ immune cells. Scale bar = 200 μM. (G) Results from IHC and RPPA analysis for T-cells infiltration: CD8+/CD4+ and CD4+/CD3+ ratio are presented. Ratio were calculated from number of positive cells for any marker/ mm2. CD4+/CD3+ ratio was decreased by IHC (p=0.038 calculated by ANOVA, followed by Dunnett’s test versus vehicle, p=0.02 for cisplatin, p=0.03 for anti-PDL1, p=0.098 for combination) and by RPPA (p=0.1 by ANOVA). Conversely, CD8+/CD4+ ratio was increased by IHC in 2/4 tumors from cisplatin and 3/4 tumors from combination arm (p>0.1 by ANOVA) and the same result were confirmed by RPPA (p>0.1 by ANOVA). (H) Images from western blot analysis on lysates from tumors harvested from the 344SQ tumor bearing mice after three days or at the end of treatment showed an increase in PD-L1 and phospho-STING levels in cisplatin-treated tumors compared to the vehicle group. (I) Quantitative PCR (qPCR) measurement of CCL5 and CXCL10 mRNA expression in tumors after indicated treatments. Data presented as mean ±SD and p values were calculated by ANOVA, followed by Tukey’s test. ***p<0.001, **p<0.01, *p<0.05. ns=not significant.

