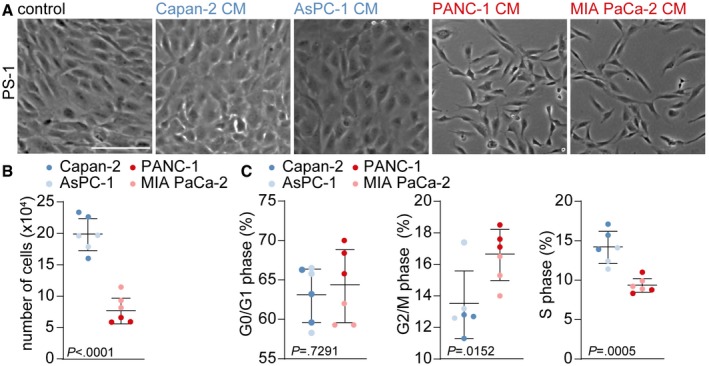
Figure 2. Mesenchymal PDAC cells reduce proliferation and alter the morphology of PSCs.

- Brightfield images of PS‐1 cells which were exposed for 72 h to CM from control (CM of PS‐1 cells), epithelial (blue) or mesenchymal (red) cell lines. Scale bar represents 100 μm.
- Quantification of bead‐calibrated cell count of PS‐1 cells after treatment indicated in panel A, using flow cytometry. n = 6 per group, 3 biological replicates for each cell line.
- EdU assay performed after treatment indicated at panel A, showing percentage of PS‐1 cells in G0/G1 phase, G2/M phase, and S phase. n = 6 per group, three biological replicates for each cell line.
