
Figure EV2. PSCs reduce mesenchymal markers in PDAC cells.
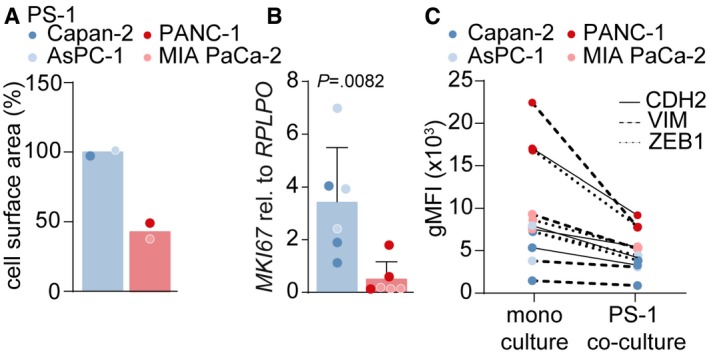
- Quantification of cell surface area of PS‐1 cells after treatment with CM from control (CM of PS‐1 cells), epithelial (blue), or mesenchymal (red) cell lines, using ImageJ. Cell surface area was normalized to average epithelial CM value. For each cell line, area was measured once.
- Gene expression level of proliferation‐marker MKi67 in PS‐1 cells after treatment indicated in panel A using qPCR. Data were normalized against control CM. Student's t‐test. n = 6 per group, 3 biological replicates for each cell line.
- Mesenchymal markers CDH2, VIM, and ZEB1 were measured in PDAC cells that were mono‐ or co‐cultured with mCherry‐expressing PS‐1 cells with flow cytometry. Representative graph of n = 2.