
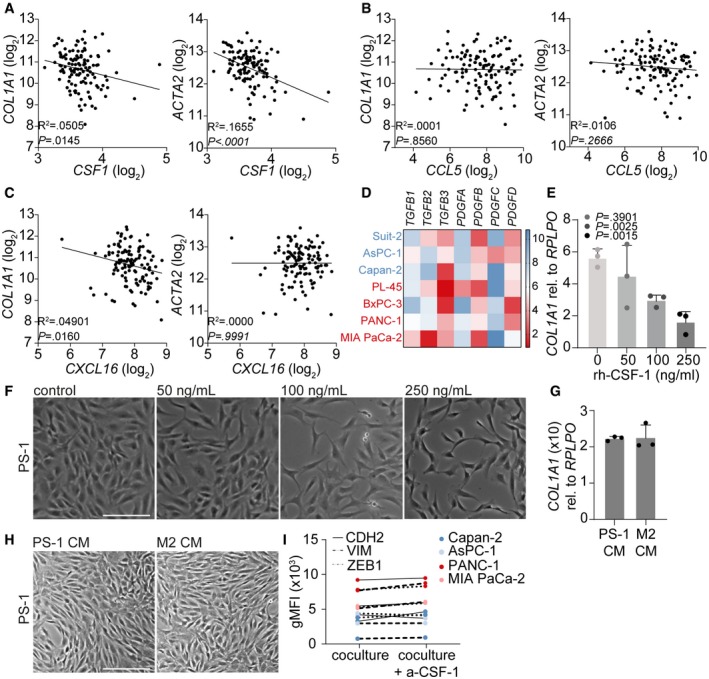
Figure EV4. CSF1 expression correlates with COL1A1 and ACTA2 in tumors.
-
A–CCorrelation between CSF1 (A), CCL5 (B), and CXCL16 (C) gene expression and COL1A1 or ACTA2 gene expression in online available PDAC patient datasets. R 2 and P‐value were analyzed with linear regression.
-
DExpression of stromal activation markers TGFB1‐3 and PDGFA‐D in online available datasets of epithelial‐like (blue) and mesenchymal‐like (red) PDAC cell lines. Scale (2–10) represents log2 transformation.
-
ERelative gene expression of COL1A1 in PS‐1 cells exposed to indicated concentrations of recombinant human CSF‐1 using qPCR. n = 3 biological replicates per group.
-
FBrightfield images of PS‐1 cells after treatment indicated in panel E. Scale bar represents 100 μm.
-
GRelative gene expression of COL1A1 in PS‐1 cells after 72‐h treatment with control CM (PS‐1 CM) or M2 macrophages CM using qPCR. n = 3 biological replicates per group.
-
HBrightfield images of PS‐1 cells after 72‐h treatment with control CM (PS‐1 CM) or M2 macrophages CM. Scale bar represents 100 μm.
-
IMesenchymal markers CDH2, VIM, and ZEB1 were measured in PDAC cells that were co‐cultured with mCherry‐expressing PS‐1 cells with or without CSF1R inhibition using flow cytometry. Representative graph of n = 2.