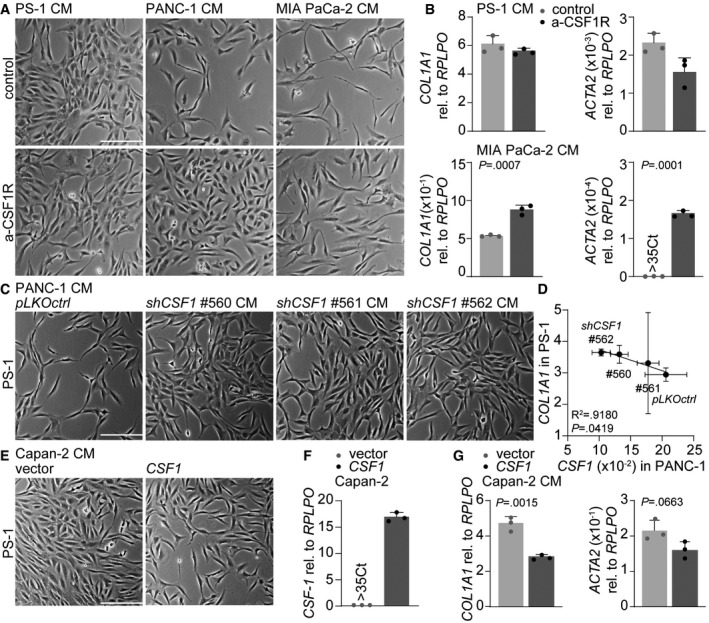
Figure 5. Targeting CSF‐1 in mesenchymal‐like PDAC cells abolishes PSC deactivation.

- Brightfield images of PS‐1 cells after 72 h of treatment with CM of control (CM of PS‐1s) or mesenchymal PDAC cell lines supplemented with anti‐CSF‐1. Scale bar represents 100 μm.
- Gene expression levels of COL1A1 in PS‐1 cells after treatment indicated in panel A using qPCR. Graph shows n = 3 technical replicates of an example experiment that was performed three times.
- Brightfield images of PS‐1 cells after 72 h of treatment with PANC‐1 CM of pLKOctrl or shCSF1 (#560–562). Scale bar represents 100 μm.
- Correlation graph of CSF1 expression in PANC‐1 pLKOctrl or shCSF1 (#560–562) and how these various CM affect COL1A1 expression in PS‐1 cells using qPCR, and values were normalized for RPLPO expression. n = 3 biological replicates for all individual experiments, error bars indicated SD. R 2 and P‐value were analyzed with linear regression.
- Brightfield images of PS‐1 cells after 72 h of treatment with CM of Capan‐2 cells with control vector or Capan‐2 cells overexpressing CSF1. Scale bar represents 100 μm.
- Gene expression level of CSF1 in Capan‐2 cells after transduction with control vector or overexpressing CSF1. n = 3 technical replicates per group.
- Gene expression levels of COL1A1 in PS‐1 cells after treatment indicated in panel E using qPCR. Graph shows n = 3 technical replicates of an example experiment that was performed three times.
