
Figure 2. Intra‐SR extensions of RyR1.
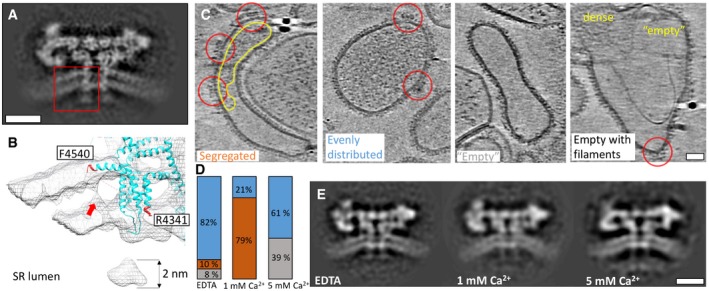
- A slice through the average structure of the apo state at a position 22 Å away from the middle slice shown in Fig 1C. The intra‐SR extension is boxed on the density in red.
- An enlarged view of a volume‐rendered representation fitted with an atomic model (PDB: 5TB2) corresponding to the region boxed in (A). The red arrow points to a density between the bilayer leaflets; this density is at a different location from the one in Fig 1C and D.
- Representative SR vesicles with different distributions of inner SR density: segregated, evenly distributed, empty and empty with filaments. RyR1 particles are circled in red, and areas circled in yellow indicate accumulation of density inside the SR.
- The fractions of vesicles that fall into each density category for each RyR1 sample (EDTA: n = 64; 1 mM Ca2+: n = 32; 5 mM Ca2+: n = 21, technical replicates). Blue corresponds to the fraction of SR lumen vesicles showing evenly distributed density, orange to segregated density and grey to empty vesicles.
- Structures of RyR1 determined in the presence of increasing Ca2+ concentration (1 and 5 mM), all with intra‐SR extensions. Scale bars: 10 nm in (A) and (E), 20 nm in (C).