-
A, B
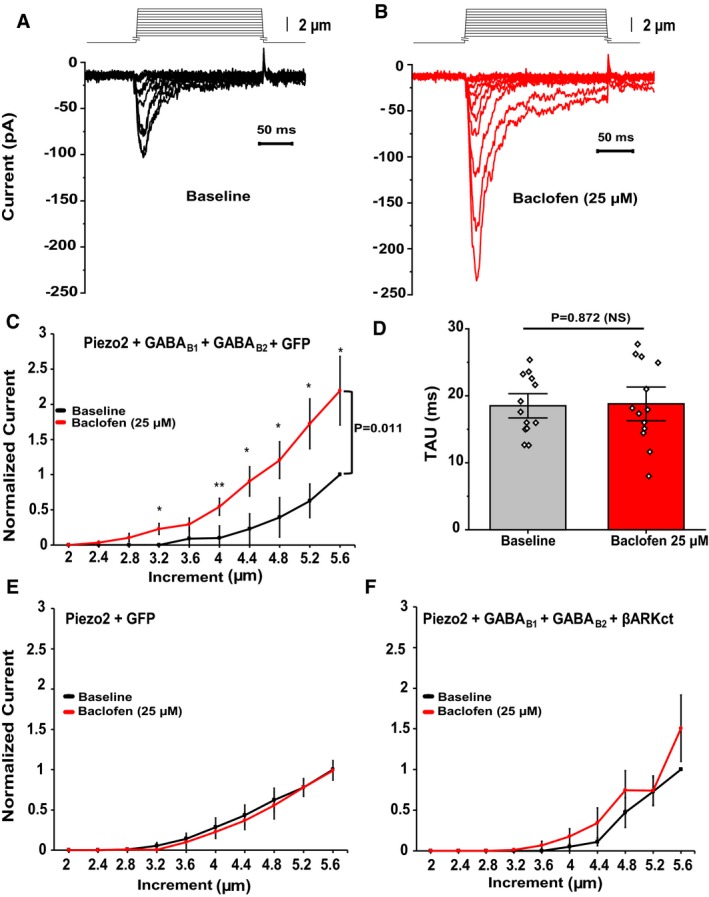
Representative MA currents recorded in whole‐cell patch‐clamp experiments at ‐60 mV in HEK293 cells transiently transfected with Piezo2 + GABAB1 + GABAB2 + GFP (for visualization) in response to repetitive mechanical stimulation with a blunt glass probe displaced 2–5.6 μm in 0.4‐μm increments every 15 s before (black) and after (red) exposure to 25 μM baclofen. Not every trace is shown for clarity.
-
C
Quantification of normalized MA currents of HEK293 cells transfected with Piezo2 + GABAB1 + GABAB2 + GFP (n = 13, *P < 0.05, **P < 0.01, before [black] and after [red] baclofen treatment, repeated‐measures ANOVA with Student's t‐test no corrections). Data are shown as mean ± SEM.
-
D
Quantification of MA current inactivation rate (Tau) in HEK293 cells transfected with Piezo2 + GABAB1 + GABAB2 + GFP before (gray) and after (red) baclofen application (n = 13, NS, not significant; paired t‐test). Data are shown as mean ± SEM and scatter plots.
-
E, F
Quantification of normalized MA currents of HEK293 cells transfected with Piezo2 + GFP (E, n = 7) and Piezo2 + GABAB1 + GABAB2 + βARKct‐mCherry (F, n = 8) before (black) and after (red) application of 25 μM baclofen. Data are shown as mean ± SEM.

