-
A, B
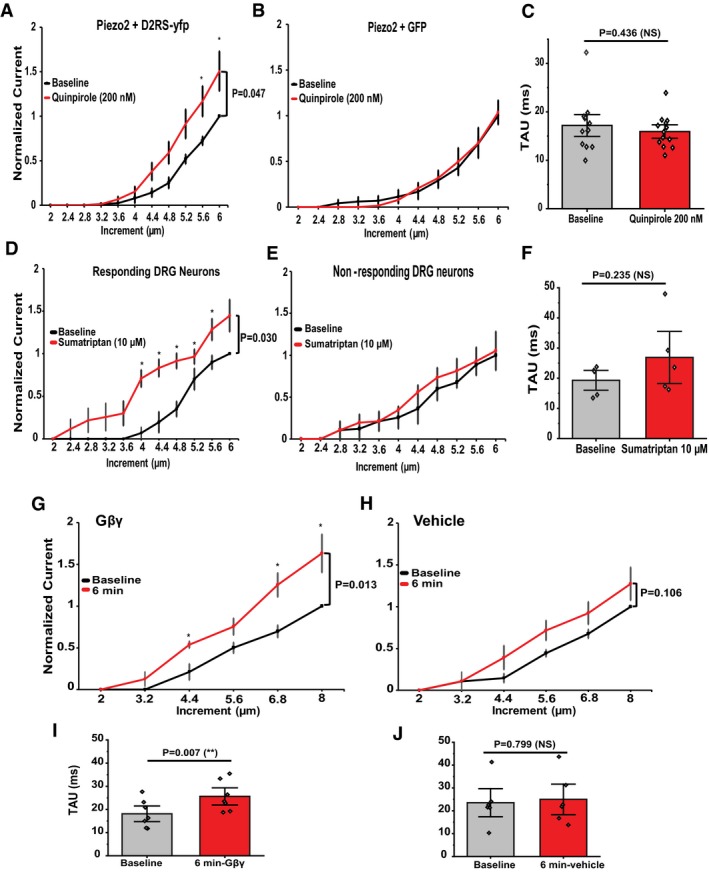
Quantification of normalized MA Piezo2 currents in HEK293 cells transiently transfected with Piezo2 + D2RS‐YFP (A, n = 13) and HEK293 cells transfected with Piezo2 and GFP (B, n = 5) before (black) and after (red) application of quinpirole 200 nM. *P < 0.05, repeated‐measures ANOVA with Student's t‐test no corrections. Data are shown as mean ± SEM.
-
C
Quantification of Piezo2 current inactivation rate (Tau) in HEK cells transfected with Piezo2 + D2RS‐YFP. Data are shown as mean ± SEM and scatter plots (n = 13)
-
D, E
Quantification of normalized MA currents in responding large DRG neurons (D, n = 5) versus non‐responding DRG neurons (E, n = 3) before (black) and after (red) application of sumatriptan 10 μM to activate the Gi‐coupled Htr1d receptors. *P < 0.05, repeated‐measures ANOVA with Student's t‐test no corrections. Data are shown as mean ± SEM.
-
F
Quantification of MA current inactivation rate (Tau) measured for responding (R) large DRG neurons (n = 5, paired t‐test). Data are shown as mean ± SEM and scatter plots.
-
G, H
Quantification of normalized MA currents recorded from large DRG neurons dialyzed with 50 ng/ml Gβγ (G, n = 7) or with 0.0001% Lubrol (vehicle for Gβγ; H, n = 6). *P < 0.05, repeated‐measures ANOVA with Student's t‐test no corrections. Data are shown as mean ± SEM.
-
I, J
Quantification of MA current inactivation rate (Tau) measured for large DRG neurons dialyzed with Gβγ (n = 7, **P < 0.01, paired t‐test) and vehicle (paired t‐test). Data are shown as mean ± SEM and scatter plots.

