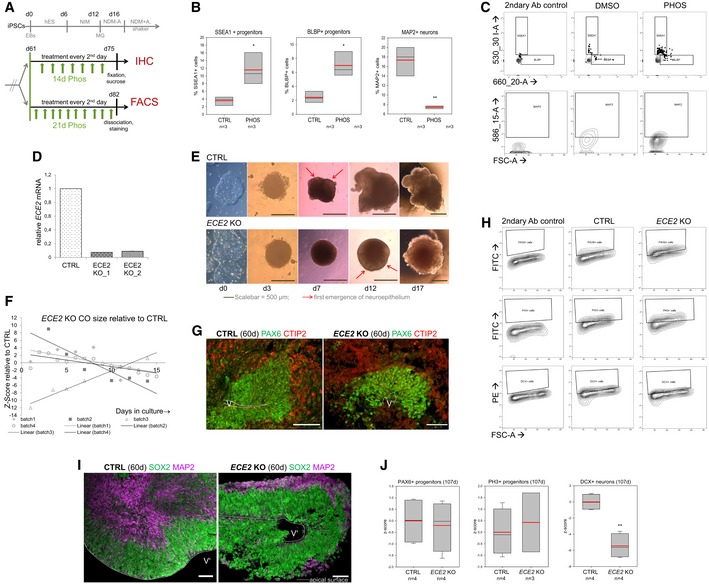
Scheme depicting the timeline of chronic PHOS treatment in COs prior to IHC or FACS analysis (hES, NIM, NDM−/+A: media for CO generation, see
Materials and Methods).
FACS analysis of PHOS‐treated COs shows an increase in neural progenitors and a decrease in neurons. Data shown as z‐scores (n = samples of three pooled COs each; box plots: mean = red line, median = black line, box represents 25th and 75th percentiles, whiskers extend to 10th and 90th percentiles, all outliers are shown; *P < 0.05; **P < 0.01 in one‐way ANOVA and Tukey's pairwise multiple comparison).
FACS plots illustrating gating strategies for SSEA‐, BLBP‐ and MAP2‐gated cells in CTRL‐ and PHOS‐treated COs. Gates were established using secondary antibody only as isotype control.
qPCR confirms the absence of ECE2 mRNA in two clones of ECE2 KO iPSCs (data shown as mean ± SEM from triplicates).
Brightfield (BF) images of ECE2 KO and isogenic control iPSCs and of COs generated from them.
Size measurement
ECE2 KO vs. CTRL COs revealed no consistent difference (data shown as
z‐scores;
n = 4 batches of COs with at least 10 COs each per time point, area measured from 2D BF images in Fiji
82).
Example images of IHC for PAX6+ dorsal neural progenitors (green) and CTIP2+ deep layer neurons (red) in CTRL and ECE2 KO COs.
FACS plots illustrating the gating strategies for PAX6‐, PH3‐ and MAP2‐gated cells in 60‐day‐old CTRL and ECE2 KO COs. Gates were established from the secondary‐only control.
Example images of progenitor zone (SOX2, green) and neuronal layer (MAP2, magenta) staining by IHC in CTRL and ECE2 KO COs.
FACS analysis of 107‐day‐old COs gated for PAX6+ or PH3+ progenitors or DCX+ neurons shows no difference in progenitors, but a reduction in neurons upon ECE2 KO also at this later stage.
Data information: Data shown as
z‐scores (
n = samples of two pooled COs; box plots: mean = red line, median = black line, box represents 25
th and 75
th percentiles, whiskers extend to 10
th and 90
th percentiles, all outliers are shown;
**P < 0.01 in one‐way ANOVA and Tukey's pairwise multiple comparison). (G, I) Scale bar = 50 μm; ventricle‐like lumen is marked by V’.