
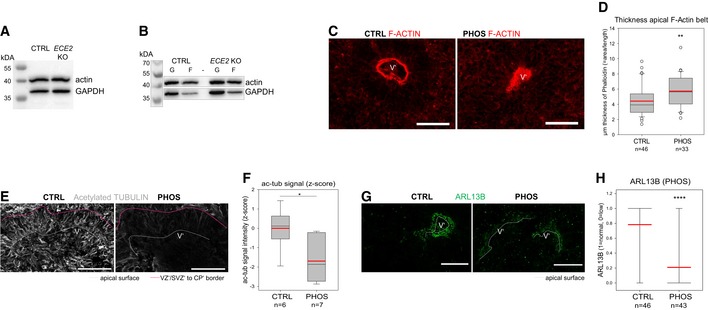
Figure EV4. ECE2 inhibition and KO cause changes in actin and microtubule cytoskeleton in COs.
-
AExample Western blot for total actin levels in COs with GAPDH as control.
-
BExample Western blot for actin levels after fractionation of G‐ and F‐actin, using GAPDH as loading control.
-
C, DThe thickness of the apical F‐actin belt is increased in PHOS‐treated COs. (C) Example images of PHOS‐ and CTRL‐treated COs with F‐actin labelled by Alexa Fluor 594‐conjugated Phalloidin. (D) The thickness of the F‐actin belt was assessed in Fiji 82 by measuring the area of F‐actin and dividing by the length of apical surface (box plot: mean = red line, median = black line, box represents 25th and 75th percentiles, whiskers extend to 10th and 90th percentiles, all outliers are shown; n = number of analysed ventricles in 2 batches; Kruskal–Wallis one‐way ANOVA on ranks and Dunn's pariwise multiple comparison: **P = 0.003; ***P < 0.001).
-
E, FThe microtubule cytoskeleton is changed upon ECE2 inhibition. (E) Example images of ac‐tub IHC in CTRL‐ vs. PHOS‐treated COs. (F) Quantification of ac‐tub signal as mean grey value in neuroepithelial regions of PHOS‐treated COs shows significant reduction upon ECE2 inhibition (n = number of analysed ventricles; *P = 0.021 in one‐way ANOVA and Tukey's pairwise multiple comparison).
-
G, HApico‐basal polarity is impaired upon ECE2 inhibition as visible in example images of ARL13B IHC in CTRL vs. PHOS (G) as assessed by quantification of germinal zones (H) for normally high (“1”) vs. reduced (“0”) apical ARL13B, revealing a reduction in normal ventricles in the absence of ECE2 (n = number of analysed ventricles from two batches; ****P < 0.0001 in exact binomial test).