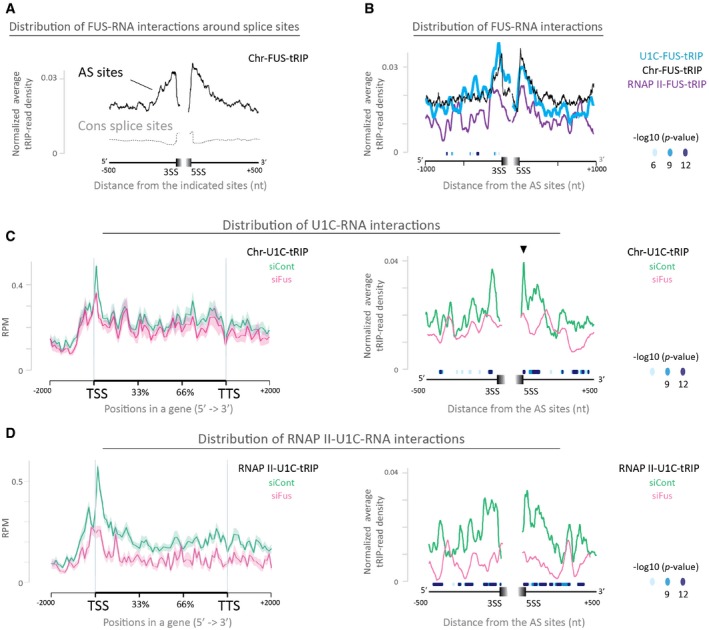
Read distributions of Chr‐FUS‐tRIP mapped around constitutive splice sites (CS sites, gray dotted line) and alternative splice sites (AS sites, black solid line). Positions of CS sites and AS sites are according to the ENSEMBL annotations on GRCm38/mm10. 3SS, 3′ splice site; 5SS, 5′ splice site.
Read distributions of RNAPII‐FUS‐tRIP (RNAPII‐FUS, purple line), U1C‐FUS‐tRIP (U1C‐FUS, blue line), and Chr‐FUS‐tRIP (Chr‐FUS, black line) around AS sites. The P‐values for the differences between RNAPII‐FUS and Chr‐FUS are indicated by circles.
Read distributions of Chr‐U1C‐tRIPs generated from Fus‐silenced cells (siFus, pink line) and those of control siRNA‐treated cells (siCont, green line). Arrowhead indicates a peak at the 5′ splice site, which disappears upon Fus silencing.
Read distributions of RNAPII‐U1C‐tRIPs generated from Fus‐silenced cells (siFus, pink line) and control siRNA‐treated cells (siCont, green line).
Data information: (C and D) Left panels show read distributions of tRIP‐seqs mapped to the relative positions of all coding genes in mouse. The standard error of mean is shown as a semi‐transparent shade around the average curve. Right panels show read distributions of tRIP‐seqs mapped around AS sites. The
P‐values for the differences between siFus and siCont are indicated by circles.

