-
A–H
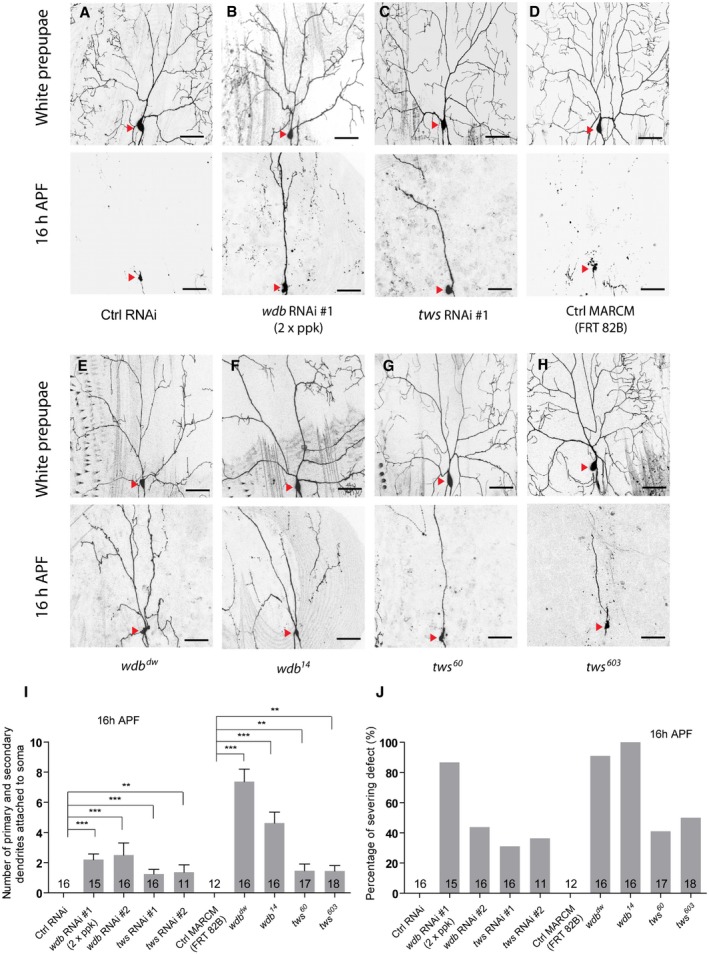
Live confocal images of ddaC neurons expressing UAS‐mCD8‐GFP driven by ppk‐Gal4 at WP and 16 h APF stages. Dendrites of ctrl RNAi (A), wdb RNAi #1 driven by two copies of ppk‐Gal4 (B), tws RNAi #1 (C), ctrl MARCM (D), wdb
dw MARCM (E), wdb
14 MARCM (F), tws
60 MARCM (G), and tws
603 MARCM (H) ddaC neurons at WP and 16 h APF stages. Red arrowheads point to the ddaC somas.
-
I, J
Quantification of number of primary and secondary dendrites attached to soma and percentage of severing defects at 16 h APF.
Data information: In (I–J), data are presented as mean ± SEM from three independent experiments. **
P < 0.01; ***
P < 0.001 (one‐way ANOVA with Bonferroni test). The number of neurons (n) examined in each group is shown on the bars. Scale bars in (A–H) represent 50 μm.
Source data are available online for this figure.

