-
A–D
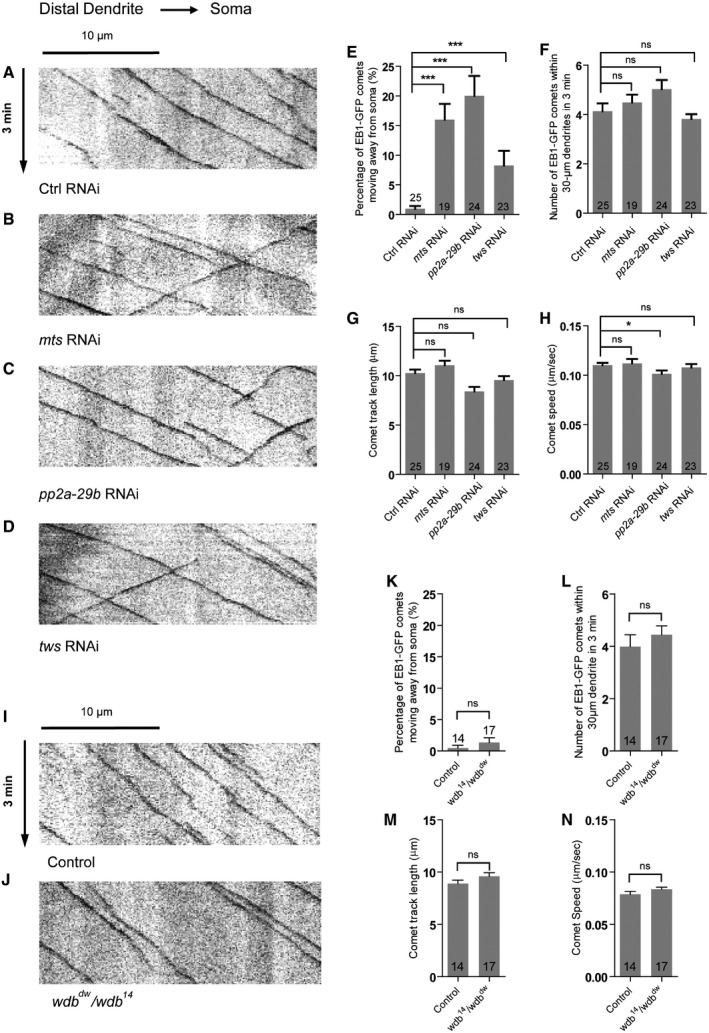
Representative kymographs depicting the movement patterns of EB1 comets in the proximal dendrites of ddaC neurons at 96 h AEL. In control RNAi (A) ddaC dendrites, EB1‐GFP comets predominantly moved toward the somas (retrograde). However, in mts RNAi (B), pp2a‐29b RNAi (C), and tws RNAi (D) ddaC dendrite branches, some EB1‐GFP comets moved away from the somas (anterograde).
-
E–H
Quantitative analyses of the percentages of anterograde EB1 comets in each neuron imaged (E), the average numbers of EB1‐GFP comets within 30 μm dendrite in 3 min (F), the average comet track length of each neuron (G), and the average comet speed of each neuron (H).
-
I, J
Representative kymographs depicting the movement patterns of EB1 comets in the proximal dendrites of ddaC neurons at 96 h AEL. In both control (I) and wdb
dw
/wdb
14 mutant (J) ddaC dendrites, EB1‐GFP comets predominantly moved toward the somas (retrograde).
-
K–N
Quantitative analyses of the percentages of anterograde EB1 comets in each neuron imaged (K), the average numbers of EB1‐GFP comets within 30 μm dendrite in 3 min (L), the average comet track length of each neuron (M), and the average comet speed of each neuron (N).
Data information: In (E–H) and (K–N), data are presented as mean ± SEM from three independent experiments. ns, not significant; *
P < 0.05; ***
P < 0.001 (E–H, one‐way ANOVA with Bonferroni test; K–N, two‐tailed Student's
t‐test). The number of neurons (n) examined in each group is shown on the bars. Horizontal arrow indicates the direction toward the somas, and vertical arrow indicates that each movie was taken for 3 min. Scale bars in (A, I) represent 10 μm.
Source data are available online for this figure.

