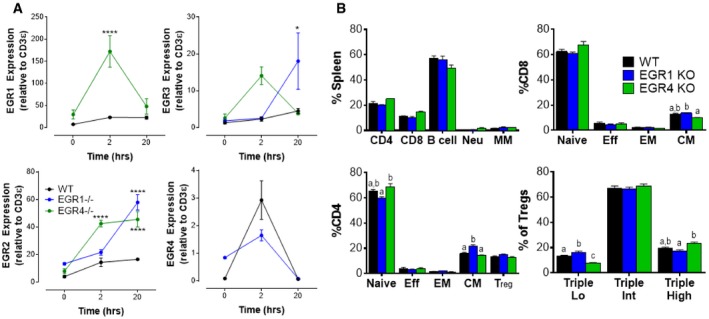
T cells were collected from age‐ and gender‐matched WT, EGR1KO, and EGR4KO mice.
CD4+ T cells were isolated from the spleen by negative selection before incubating with anti‐CD3/CD28 antibodies for the indicated time periods. Levels of expression of EGR1, EGR2, EGR3, and EGR4 were measured by qPCR.
WBC was collected from WT, EGR1KO, and EGR4KO mice before staining and FACS analysis to determine composition (gating strategies in
Appendix Fig S1). Subclasses of CD8
+, CD4
+, and Treg populations were determined as shown.
Data information: Data in panel (A) (mean ± SEM; a minimum of three biological replicates were examined; each biological replicate includes two technical replicates) were analyzed by two‐way ANOVA with post hoc tests. Changes in the expression of each gene over time were EGR‐dependent. EGR1 (
P = 0.0017); EGR2 (
P < 0.0001); EGR3 (
P = 0.0031); EGR4 (
P = 0.0309). Differences from WT at specific time points due to EGR deletion are marked with *
P < 0.05; ****
P < 0.0001. Differences between WT, EGR1KO, and EGR4KO WBC in panel (B) (mean ± SEM; a minimum of three biological replicates were examined; each biological replicate includes two technical replicates) were determined by one‐way ANOVA. Statistically distinct groups were determined by post hoc analysis and marked as a, b, and c.

