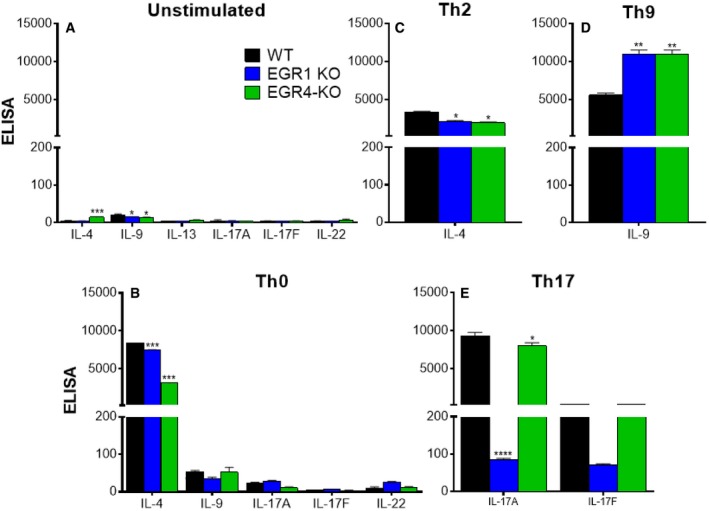
Figure EV1. Cytokine expression patterns in WT, EGR1KO, and EGR4KO CD4+ cells cultured under polarized conditions from Fig 3 .

-
A–ECD4+ T cells were isolated from the spleens of WT, EGR1KO, and EGR4KO mice by cell sorting. Cells were incubated for 5 days without stimulation (A) or under Th0 (B)‐, Th2 (C)‐, Th9 (D)‐, or Th17 (E)‐polarizing conditions before analysis of cytokine production by ELISA. Data are presented as mean ± SEM; a minimum of three biological replicates were examined; and each biological replicate includes two technical replicates. Differences in cytokine production were determined by one‐ or two‐way ANOVA as appropriate. Post hoc analysis revealed EGR‐dependent differences in cytokine production *P < 0.05; **P < 0.01; ***P < 0.001; ****P < 0.0001.
