
Figure 7. Attenuated melanoma lung colonization and metastasis in EGR4−/− mice.
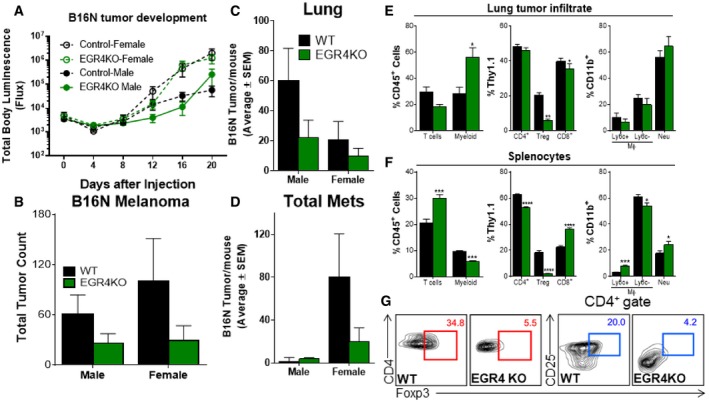
B16N melanoma cells stably expressing GFP‐luciferase were injected into syngeneic WT and EGR4−/− mice by tail vein injection.
-
ALuciferase expression was monitored by IVIS imaging at the indicated time points after luciferin injections.
-
B–DMice were sacrificed on day 20, and tumors were counted. Data are presented as total/mouse (B), lung tumors (C), and metastatic tumors (all tumors found outside of the lungs; (D). N = 9 for each gender and genotype. Differences in luciferase activity measured by IVIS in panel (A) were determined by two‐way ANOVA. Changes in luciferase activity were significantly altered in EGR4 knockout mice (P < 0.0112).
-
E–GAll lung tumors were isolated from both WT and EGR4KO mice along with spleens and analyzed for CD45+ cells. WT lung tumors were 5.407 ± 1.843% CD45+, while EGR4KO mice were 12.445 ± 2.239% CD45+. WT spleens were 83.92 ± 3.344% CD45+, while EGR4KO mice were 95.13 ± 1.856% CD45+. Relative distributions of T and myeloid cells within the CD45+ populations were determined by flow cytometric analysis. (E, F) Distributions of T and myeloid cells found within lung tumors (E) versus the spleen (F). (G) Representative FACS plots depicting gating strategies for defining Treg cell populations in panels (E and F); staining controls are in Appendix Fig S7.