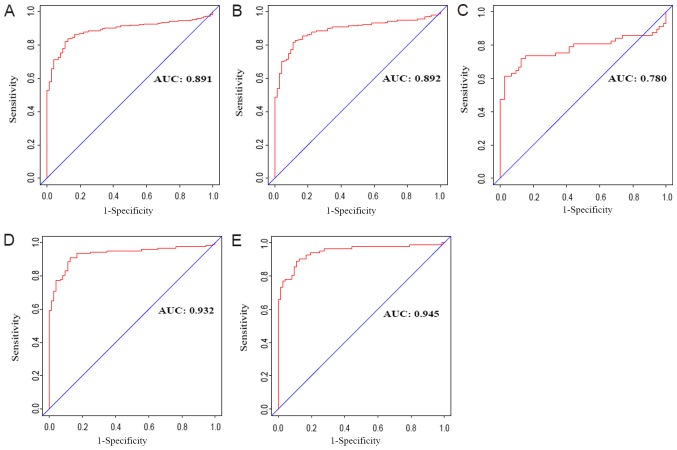
Figure 3.
Diagnostic value of AGAP2-AS1expression in clear cell renal carcinoma. (A) Receiver operating characteristic curve for AGAP2-AS1 expression in normal renal tissue and clear cell carcinoma. (B) Normal vs. tumor in stage I. (C) Normal vs. tumor in stage II. (D) Normal vs. tumor in stage III. (E) Normal vs. tumor in stage IV. AUC, area under the curve.

