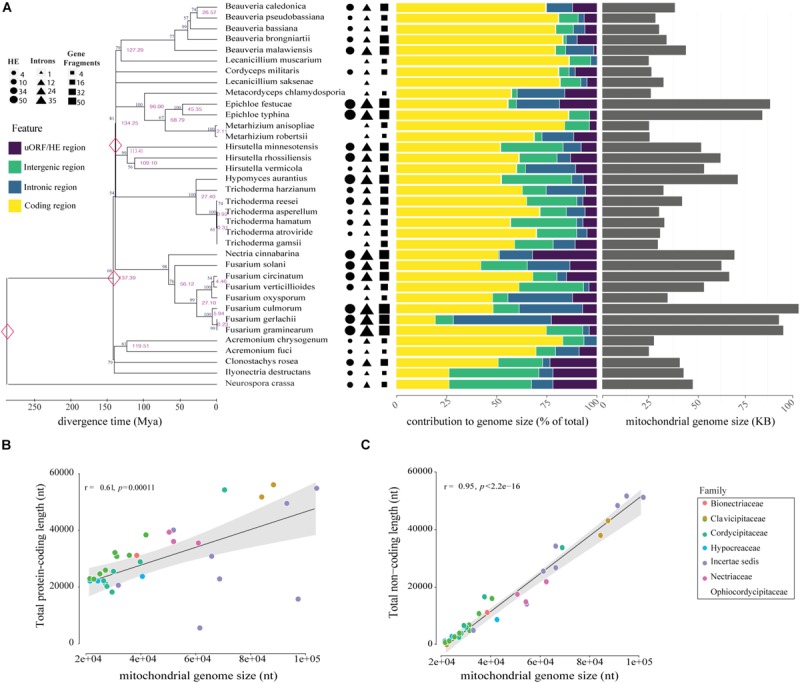
FIGURE 2.

Genomic and phylogenetic characterization of the 35 mitogenomes analyzed in this study. (A) Timetree analysis, mitogenome composition (%) and genome size (nt) of species evaluated are shown on the left, middle and right panels, respectively. In the analysis of genomic content, yellow represents protein-coding regions, purple represents uORF and HEGs, introns are showed in blue and intergenic region in green. Genomic data was normalized according to the mitogenome size of each species. Correlations between mitogenome size and protein-coding (B) or non-coding content (C). Correlation was computed using Pearson test.
