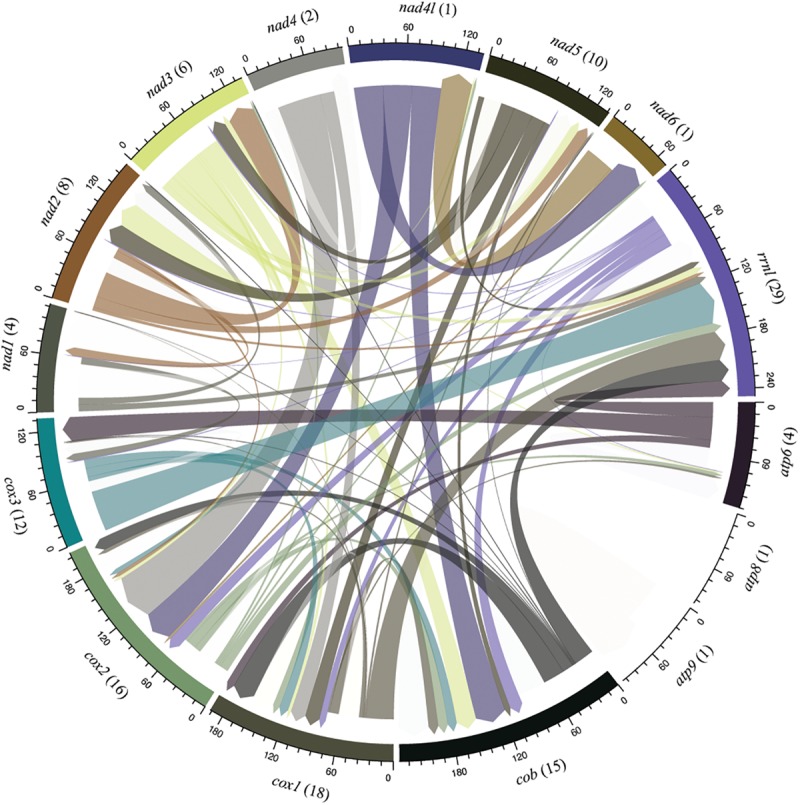
FIGURE 6.

Sharing profile of group I introns according to the mitochondrial gene origin. Circular plot indicates intron sharing pattern based on sequence similarity among core elements of the mitochondrial genomes. Each gene is represented by a colored segment. Introns that are shared with more than one gene (translocation) are shown in different color. Introns shared among species located within the same gene are not shown in the figure and were investigated in the Figure 7. The number of introns shared in each gene are indicated in parenthesis. Introns from the genes atp8 and atp9 present sequence similarity only with introns identified in its respective gene.
