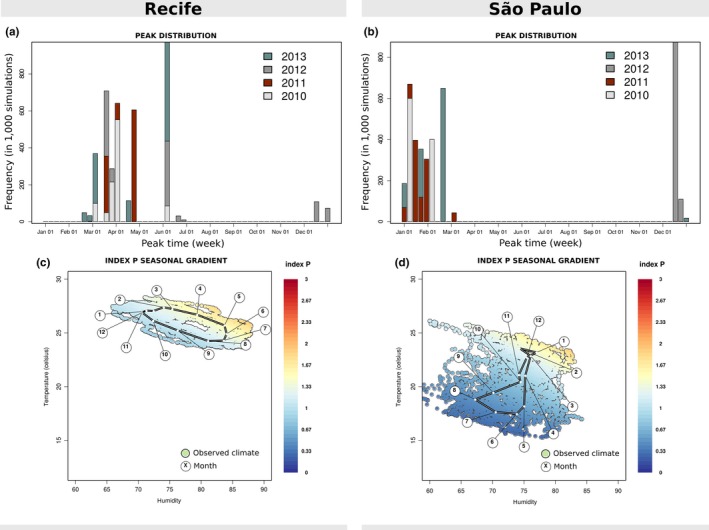
Figure 2.

Seasonality of index P for Recife and São Paulo. (a, b) For each year coloured differently, the week with highest suitability is identified across all estimated index P solutions of that year (solutions’ mean and 95% CI in Figure 1). The frequency of each peak week shown across the 1000 simulations. (c,d) Two‐dimensional sensitivity of mean index P per humidity (x) and temperature (y) observed time point (day). Each point is a combination of observed climate variables, coloured according to the mean index P estimated (colour scale on the right). The white dots (over the black link) mark the mean humidity and temperature of each month over the period of the data (2005–2016); the floating circles with numbers identify each month's number
