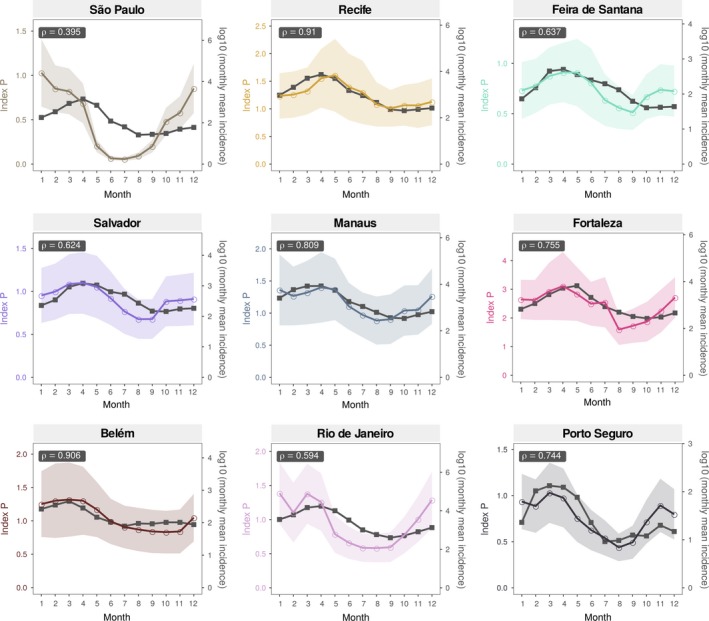
Figure 4.

Correlation of index P and notified cases in nine Brazilian cities. Monthly mean time series of index P and dengue notified case data (period 2007–2012) are shown for nine cities (in order, per row, left to right): São Paulo, Recife, Feira de Santana, Salvador, Manaus, Fortaleza, Belém, Rio de Janeiro and Porto Seguro. The geographical location of these cities is shown in the maps of Figure 3. Pearson's correlation coefficient () is shown within each subplot. The coloured shaded areas standard deviation of the index P estimates. Six other cities that widen the geographical range of the examples are presented in Figure S5 in S1 Text. Sensitivity of (Pearson's) to two priors (biting rate and mosquito life span) are presented in Figures S6–S7 in S1 Text
