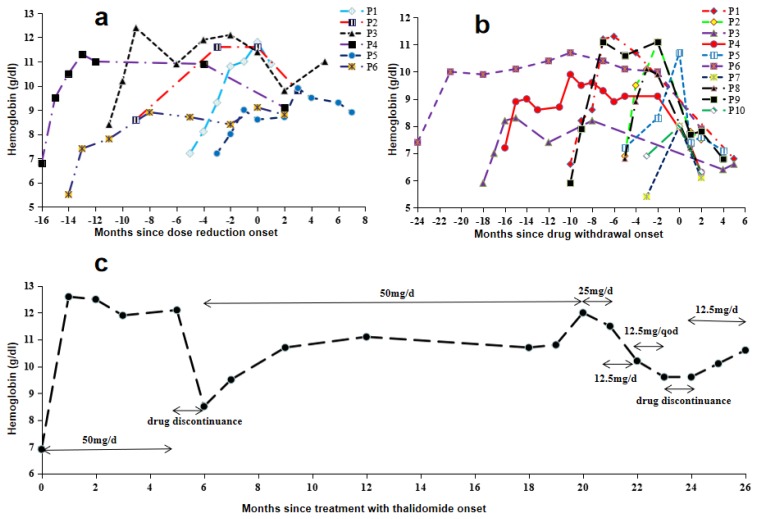
Figure 2.
Hemoglobin levels of patients with drug discontinuation and adjustment of dosages. (a) Hemoglobin levels of patients with dose reduction. P1, P2, P3 and P4 indicate patients with a dose reduction from 50 mg/d to 25 mg/d. P5 and P6 signify patients with a dose reduction from 100 mg/d to 50 mg/d. (b) Hemoglobin levels of the patient subjected to multiple dose adjustments. (c) Hemoglobin levels of patients with drug discontinuation.

