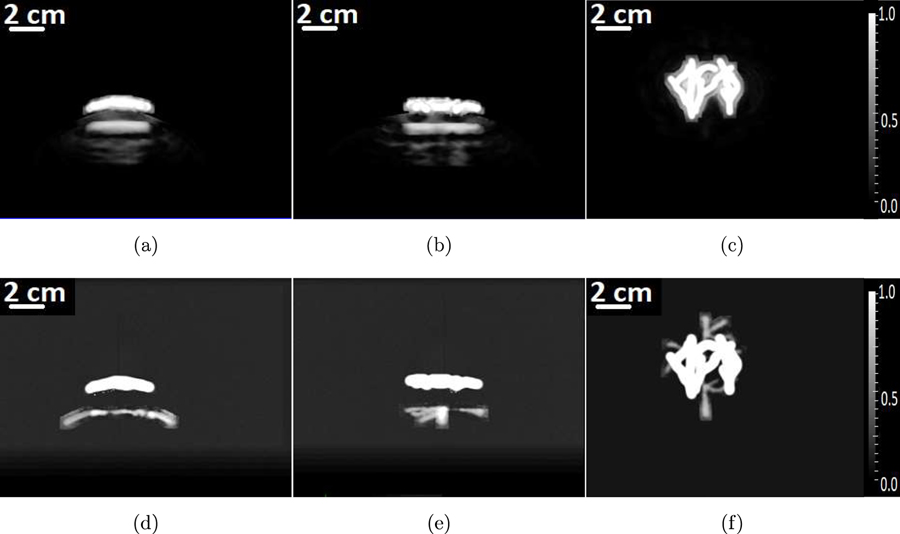
Figure 4:
The MIP of the reconstructed 3D initial pressure distribution. The first row of images corresponds to images reconstructed using the matched adjoint operator. The second row of images corresponds to images reconstructed using the OBRM. Each column of images corresponds to the MIP of the 3D initial pressure distribution along x-, y- and z-axes, respectively.

