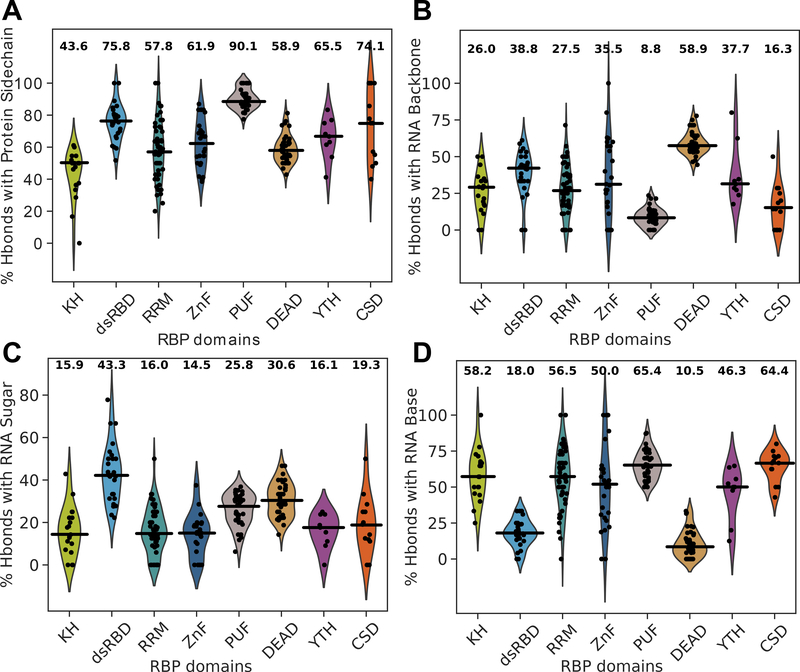
Figure 4.
Assessment of protein-RNA hydrogen bonds in over 200 structures, organized by RNA binding domain. Averages for each statistic are listed above each domain’s violin plot and medians are indicated with black horizontal bars. (A) The percent of protein-RNA hydrogen bonds that are formed using protein sidechains (as opposed to the mainchain). (B) The percent of protein-RNA hydrogen bonds that are formed with RNA backbone atoms. (C) The percent of protein-RNA hydrogen bonds that are formed with RNA sugar atoms. (D) The percent of protein-RNA hydrogen bonds that are formed with RNA base atoms.

