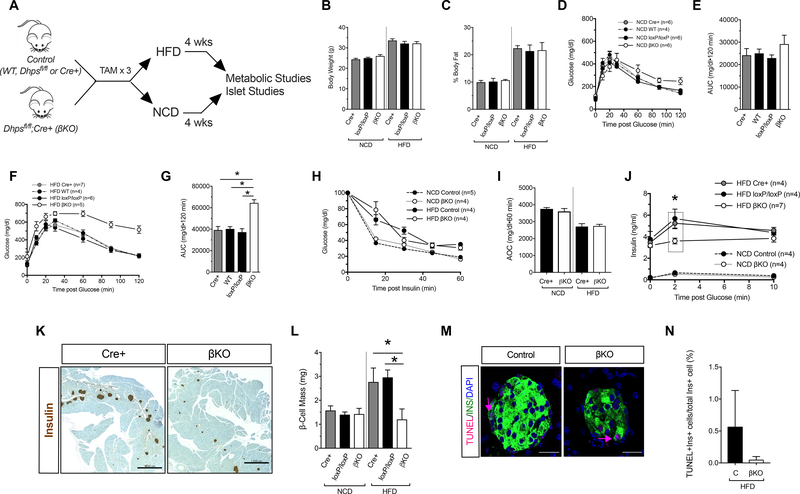
Figure 1: β-cell-specific knockout of Dhps impairs glucose tolerance after HFD-feeding.
Control (WT, Cre+ or DhpsloxP/loxP) and DhpsΔβ (βKO) mice were fed for 4 weeks with a normal chow diet (NCD) or high fat diet (HFD) and metabolic parameters were assessed. (A) Schematic timeline showing the period of tamoxifen (TAM) injections and feeding. (B) Body weight at the conclusion of the feeding regimen. Data from N=5 mice per group. (C) Percent body fat at the conclusion of the feeding regimen. Data from N=4 mice per group. (D) Glucose tolerance test in NCD-fed mice. (E) Area under the curve (AUC) analysis of glucose tolerance tests in (D). (F) Glucose tolerance test in HFD-fed mice. (G) AUC analysis of glucose tolerance tests in (F). (H) Insulin tolerance test in NCD- and HFD-fed mice. (I) Area over the curve (AOC) of insulin tolerance test in (H). (J) Serum insulin levels during a glucose tolerance test. (K) Images of whole pancreatic sections from representative HFD-fed control and DhpsΔβ mice immunostained for insulin (brown) and counterstained with hematoxylin. Scale bar, 1000 μm. (L) Quantitation of pancreatic β-cell mass. Data from N=3–6 mice per group. (M) Representative images of pancreata stained for TUNEL (red), insulin (green) and nuclei (DAPI, blue). Scale bar, 50 μm. (N) Quantification of TUNEL immunostaining (N=3 mice per group). Data presented as mean ± SEM; *p-value < 0.05 for the comparisons shown by one-way ANOVA.

