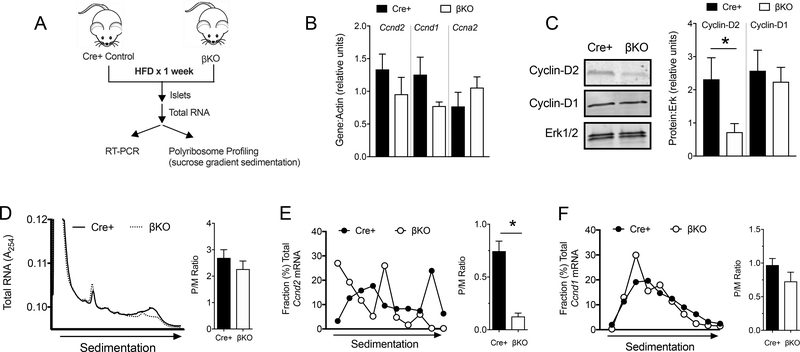
Figure 5: Decreased mRNA translation of Cyclin-D2 in DhpsΔβ mice.
(A) Schematic showing experimental design. Control (Cre+) and DhpsΔβ (βKO) mice were fed a HFD for 1 week and islets were isolated and subjected to RT-PCR and polyribosome profiling (PRP) analysis. (B) Quantitative RT-PCR from islets for the genes indicated. Data from N=5–6 animals per group. (C) Representative immunoblot analysis from islets for Cyclin-D2, Cyclin-D1, and Erk½ (left) and quantification of immunoblots (right). Data from N=3–5 animals per group. (D) PRP of isolated islets (left) and quantification of polyribosome:monoribosome ratio (right). Data from N=3 mice per group. (E) Quantitative RT-PCR of Cycd2 in polyribosomal fractions. Data from N=3–4 mice per group. (F) Quantitative RT-PCR of Cycd1 in polyribosomal fractions. Data from N=3–4 mice per group. Data presented as mean ± SEM; *p-value < 0.05 by T test.

